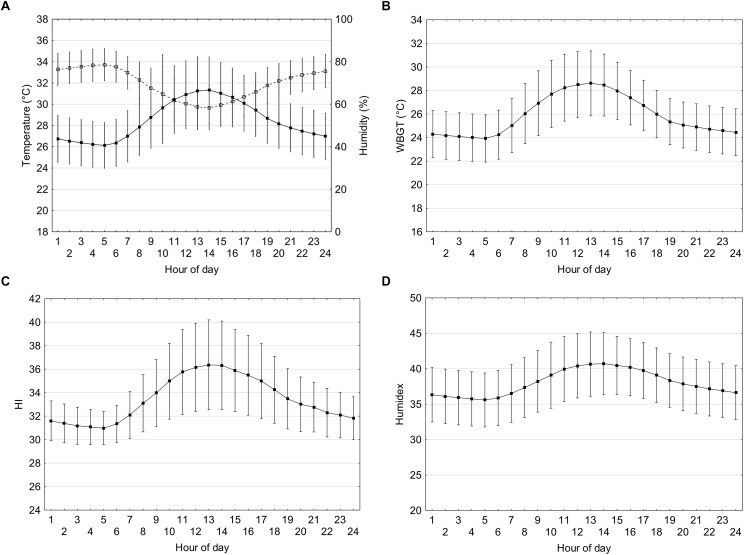
FIGURE 1.
Temperature (black squares) and relative humidity (open squares) (A), WBGT (B), HI (C), and Humidex (D) at hourly intervals based on meteorological data from the past 29 years (1990–2018) during the dates corresponding to the Olympic period (July 24th until August 9th). Vertical bars represent one standard deviation.

