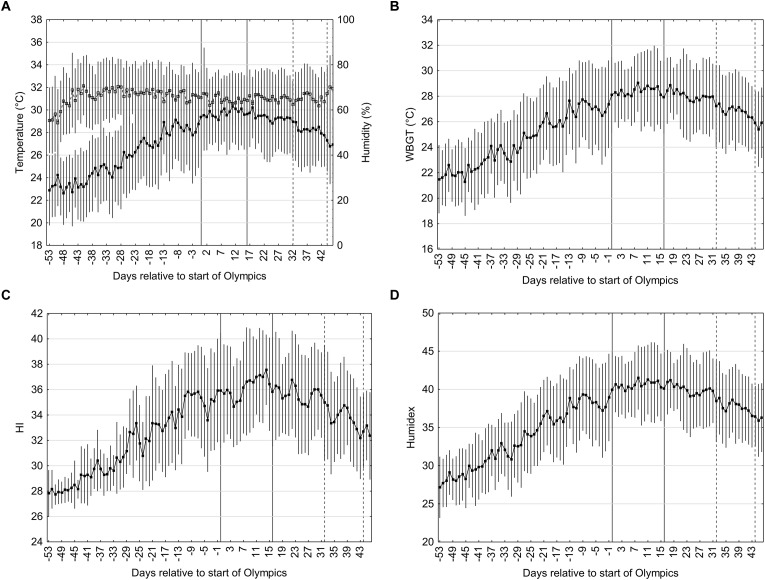
FIGURE 4.
Temperature (black squares) and relative humidity (open squares) (A), WBGT (B), HI (C), Humidex (D) on the days prior to the start of the Olympics and Paralympics. Data is the mean (±SD) during the time period of 12:00–15:00 h obtained from hourly metrological data from the past 29 years (1990–2018). The Olympics period is coded on day 0 to 16 and the Paralympics on day 32 and 44; the former is in between the solid lines and the latter between the dotted lines. Vertical bars represent one standard deviation.

