FIGURE 2.
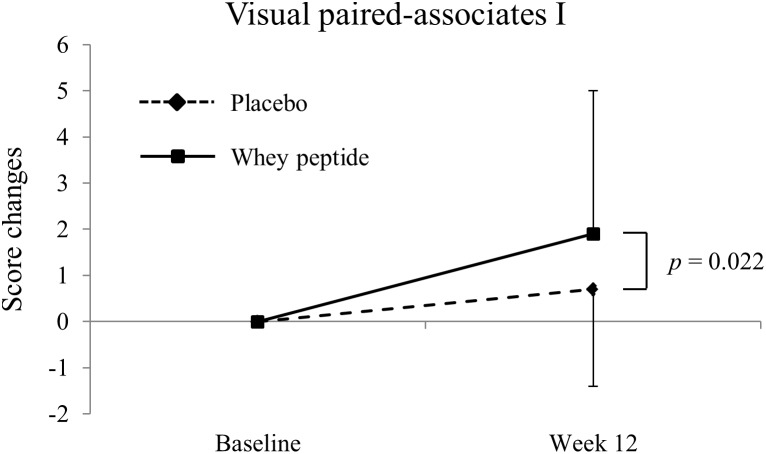
Changes of visual paired-associates I from baseline. The solid line shows the whey peptide group (n = 51), and the dashed line shows the placebo group (n = 53). The data are presented as the mean with SD. The p-value shows the results of between-group comparison, performed by unpaired t-test. p < 0.05 was considered as significant difference.

