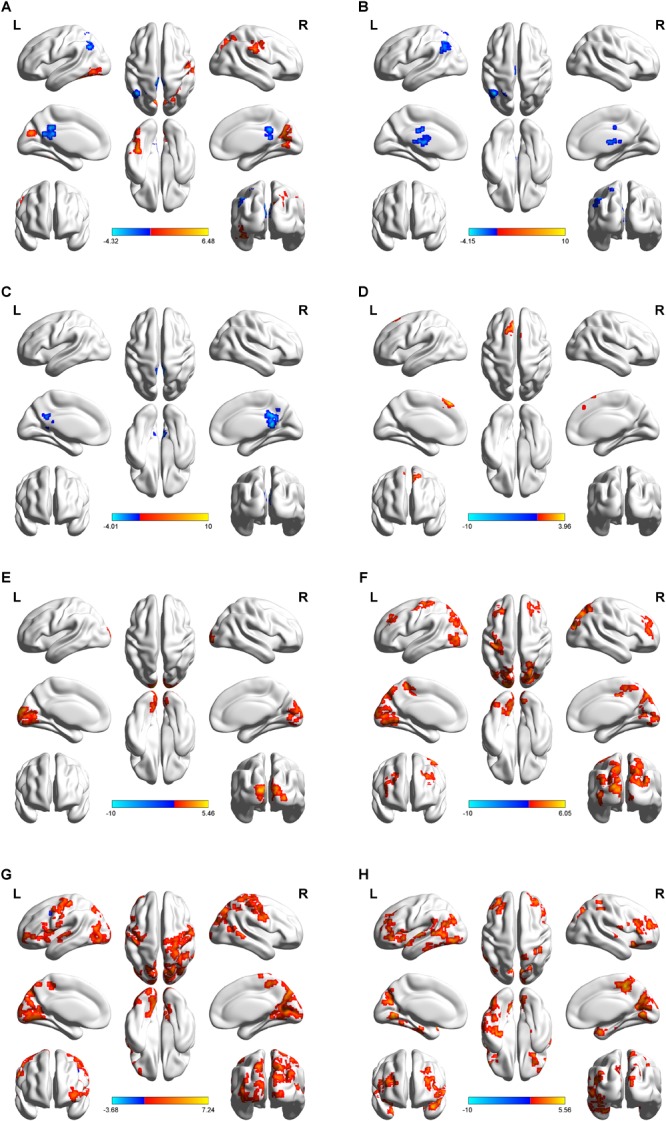
FIGURE 2.

Regional distribution of altered functional connectivity between post-theta-burst stimulation and baseline in healthy subjects. Short-term of aftereffects on brain functional connectivity (FC) induced by intermittent theta burst stimulation (iTBS) followed the contralateral continuous theta burst stimulation (cTBS) (i.e. “virtual lesion”) over the suprahyoid muscle cortex. The upper images represent static FC (A) and a serial of dynamic FC maps (B–H). Lateral, dorsal, medial, basal and posterior views are shown in every figure. Color bar indicates the T-value at the bottom. Areas color-coded in red (blue) indicate the regions in which the values of FC corresponding to post-TBS were higher (lower) than those of pre-TBS (p < 0.05, AlphaSim correction was performed to correct for multiple comparisons). Surface visualization of regions with abnormal FCs using BrainNet Viewer (http://www.nitrc.org/projects/bnv/). For static FC comparison (A), increased FC was found in the precuneus, left fusiform gyrus, and right pre/post-central gyrus, and decreased FC was observed in posterior cingulate gyrus (PCC) and left inferior parietal lobule. In dynamic FC analysis, post-TBS showed reduced FC in left angular and PCC on the early windows (B,C), in the following windows (D–H), increased FC in multiple cortical areas including bilateral pre- and postcentral gyri and paracentral lobule, and non-sensorimotor areas including a body of prefrontal, temporal and occipital gyrus, and brain stem. The details are presented in Table 1.
