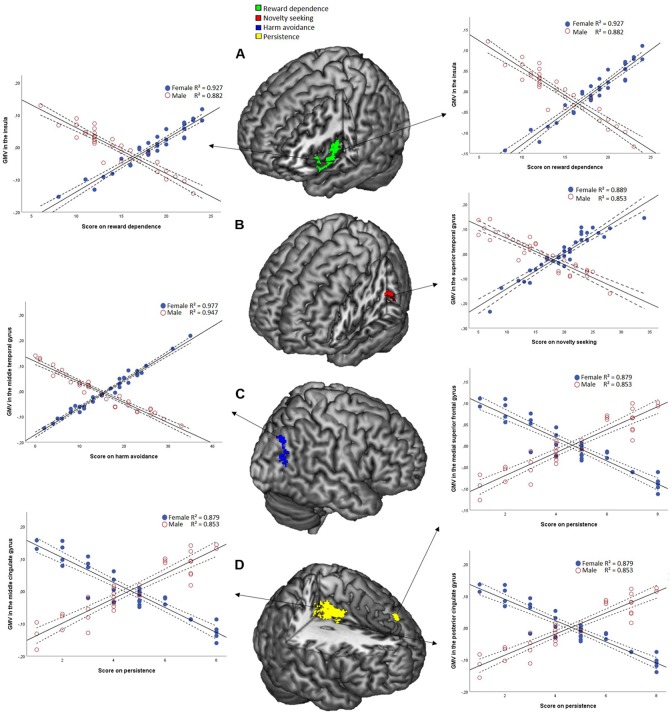
FIGURE 2.
Full factorial model results obtained at a statistical threshold of Pheight < 0.001 (k = 10), combined with SVC, FWE-corrected at cluster level. The results are shown at a significance level of P = 0.05 and are overlaid on a canonical 3-dimensional–rendered MRI brain template with a cut-out. (A) In the middle a statistical map displaying the sex-temperament interaction effects on GMv for reward dependence. Left and right the partial correlation (Female: r = 0.963, Male: r = –0.939) between GMv in the insula as a function of reward dependence. (B) In the middle a statistical map displaying the sex- temperament interaction effects on GMv for novelty seeking. Right a scatterplot showing the partial correlation (Female: r = 0.943, Male: r = –0.925) between GMv in the superior temporal gyrus as a function of novelty seeking. (C) In the middle a statistical map displaying the sex-temperament interaction effects on GMv for harm avoidance. Left a scatterplot showing the partial correlation (Female: r = 0.989, Male: r = –0.973) between GMv in the middle temporal gyrus as a function of harm avoidance. (D) In the middle a statistical map displaying the sex-temperament interaction effects on GMv for persistence. Left a scatterplot showing the partial correlation (Female: r = –0.938, Male: r = 0.924) between GMv in the middle cingulate gyrus as a function of persistence. Right a scatterplot showing the partial correlation (Female: r = –0.938, Male: r = 0.924) between GMv in the medial superior frontal gyrus as a function of persistence and the partial correlation (Female: r = –0.938, Male: r = 0.924) between GMv in the posterior cingulate gyrus as a function of persistence.

