
Figure 6.
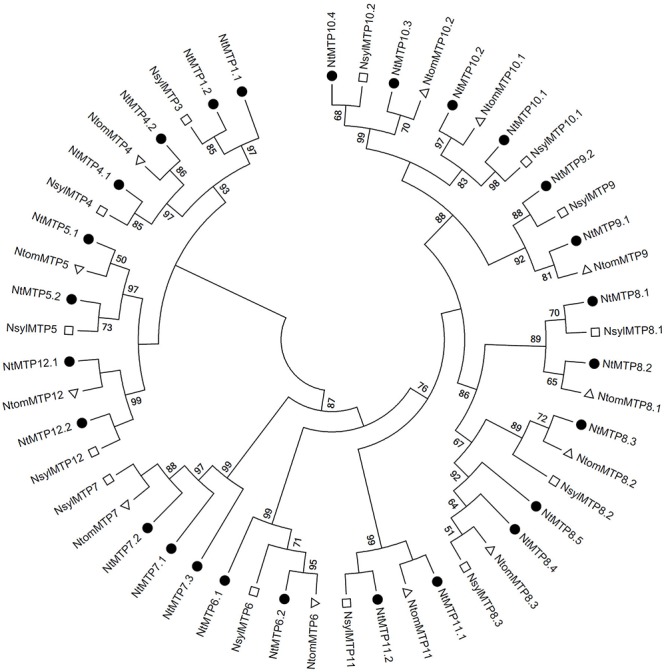
Phylogenetic relationship of MTP proteins in three main Nicotiana species. The tree was generated using the MEGA 6.0 software by the Maximum Likelihood method based on the JTT matrix-base model with bootstrap of 1000 replicates. The solid circles represent the MTP proteins from N. tabacum. The hollow squares represent the MTP proteins from N. sylvestris. The hollow triangles represent the MTP proteins from N. tomentosiformis.