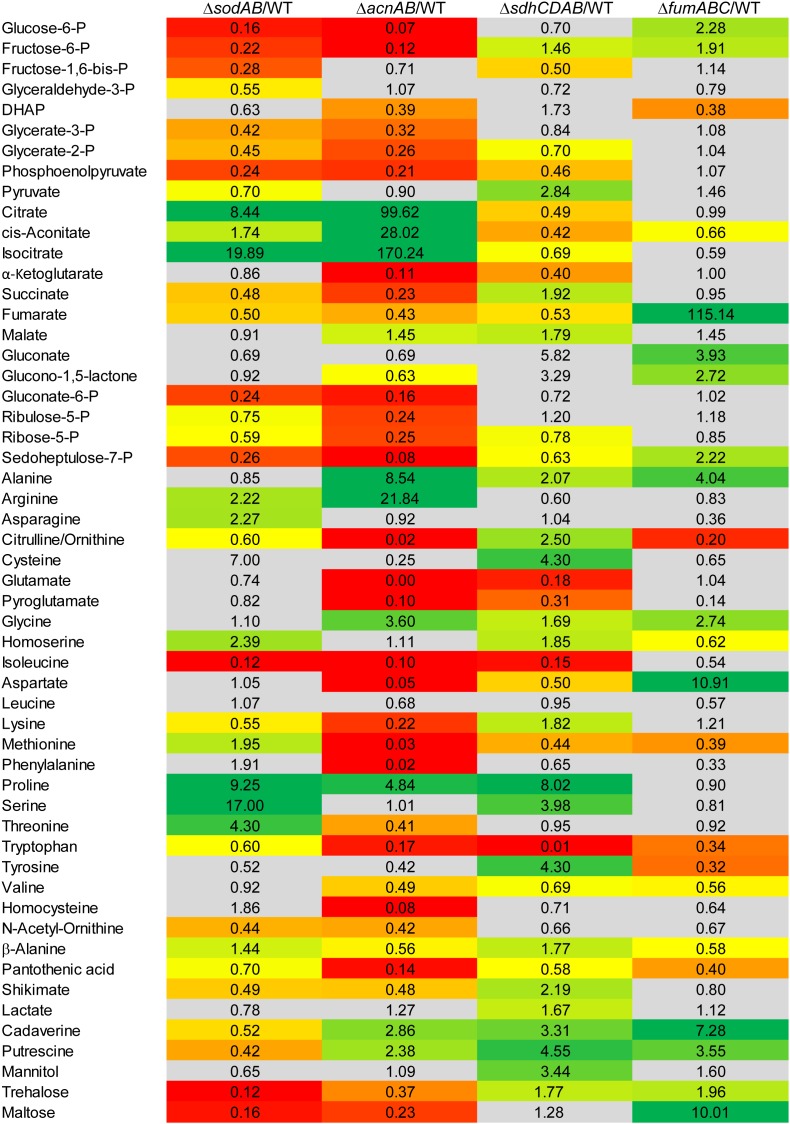
FIGURE 3.
Comparison of the metabolic profiles of STM ΔsodAB and mutant strains defective in aconitases or fumarases and succinate dehydrogenase. STM WT and STM ΔsodAB, STM ΔacnAB, STM ΔsdhCDAB and STM ΔfumABC were cultured aerobically in LB broth for 18.5 h at 37°C. Cells were harvested and metabolites extracted for subsequent GC-MS analyses. Metabolite levels were normalized to WT levels and means of at least four biological replicates are shown. Background colors indicate the relative concentration of the respective metabolite in the mutant strains compared to WT (red = decreased; green = increased). Gray background indicates indifferent concentrations between STM mutant and WT strains (Student’s t-test, p < 0.05).

