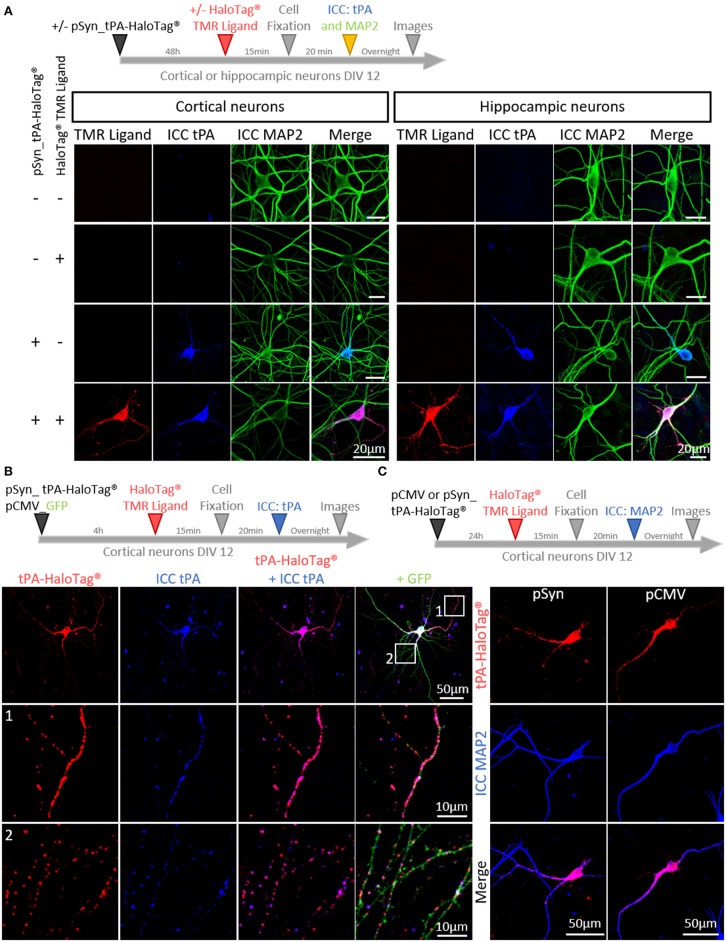
Figure 2.
Characterization of tPA-HaloTag® plasmids. (A) Timeline of the experiments. Representative confocal images of cortical and hippocampal neurons transfected (+) or not (–) at DIV12 (Day In Vitro) with pSyn_tPA-HaloTag® and exposed 48 h later (+) or not (–) to the HaloTag® TMR ligand, together with an immunocytochemistries (ICC) against tPA (blue) and MAP2 (green). Scale Bar: 20 μm. (B) Transfection of cortical neurons at DIV 12 with pSyn_tPA-HaloTag® (red) and pCMV_GFP (green) plasmids, exposed 4 h later to the HaloTag® TMR ligand and ICC performed to reveal tPA (in blue). Z-stack and scale Bar: 50 μm (whole neuron) and 10 μm (1 and 2: whole neuron zoom). (C) Timeline of the experiments. Transfections of pCMV_tPA-HaloTag® or pSyn_tPA-HaloTag® (both revealed in red) and immunochemistry raised against MAP2 (in blue) show similar neuronal expressions of tPA-HaloTag® with the two constructs. Scale of tPA-HaloTag® with the two constructs. Scale Bar: 50 μm (whole neuron).

