Figure 4.
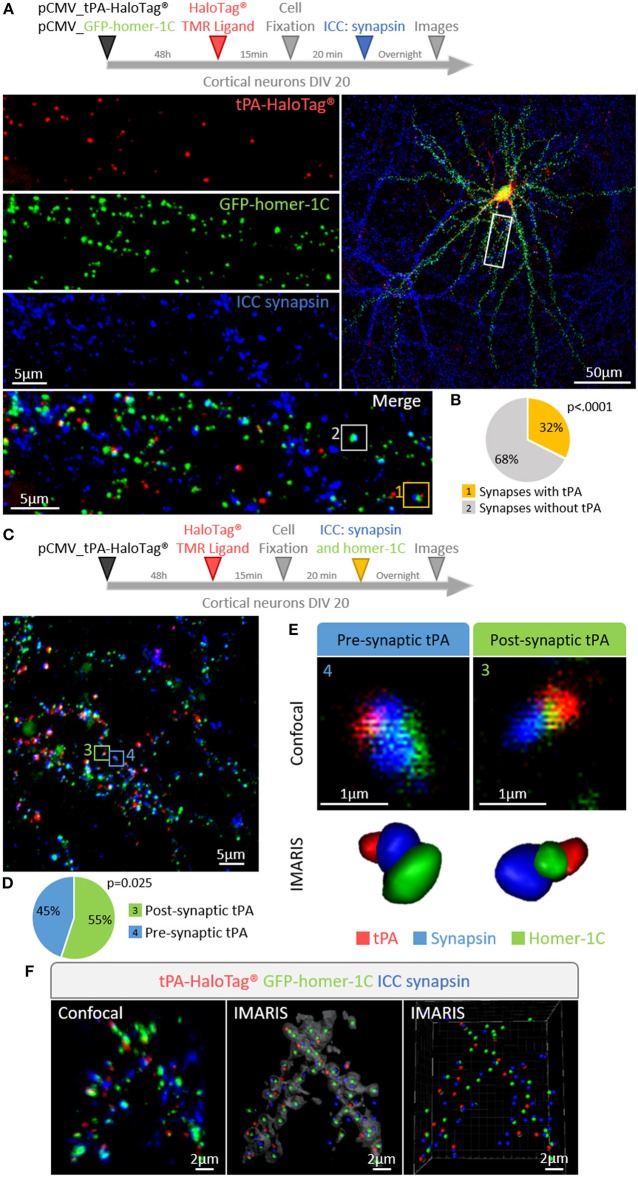
tPA is present in pre- and post-synaptic elements. (A) Timeline of the experiments. Representative z-stack confocal images of cortical neurons (at DIV 20) co-transfected with pCMV_tPA-HaloTag® and pCMV_GFP-homer-1C plasmids followed by immunocytochemistry raised against synapsin. tPA-HaloTag® (TMR ligand, in red) is present at synapses revealed by the presence of GFP-homer-1C (post-synaptic protein, green) and synapsin (pre-synaptic protein, blue). Scale Bar: 5 or 50 μm (whole neuron). (B) Representative diagrams showing the percentages of synapses containing or not tPA-HaloTag®. TMR staining (i.e., tPA) is present in 32% of all synapses (yellow frame: 1) and 68% of synapses are negative for tPA (white frame: 2), N = 21 neurons from N = 6 independent cultures and p < 0.0001. (C) Timeline of the experiments. Cortical neurons at DIV 20 were transfected with pCMV_tPA-HaloTag® plasmid, ICC raised against synaspin and homer-1C were performed. Representative z-stack confocal images and diagrams show the percentages of tPA located either pre or post-synaptically. Scale Bar: 5 μm. (D) 55% of all synaptic tPA is post-synaptic (green frame in confocal image; 3) and 45% of all synaptic tPA is pre-synaptic (blue frame in confocal image; 4). N = 10 neurons from N = 2 independent cultures and p = 0.025. (E) IMARIS reconstructions from confocal images C of pre-synaptic tPA (blue frame; 4) and post-synaptic tPA (green frame; 3). (F) Representative 3D-confocal images of co-transfected cortical neurons (at 3D-confocal images of co-transfected cortical neurons (at DIV20) with pCMV_tPA-HaloTag® (in red) and pCMV_GFP-homer-1-C (in green) plasmids followed by immunocytochemistry raised against synapsin (in blue). IMARIS reconstruction from confocal images. Scale Bar: 2 μm.

