Figure 6.
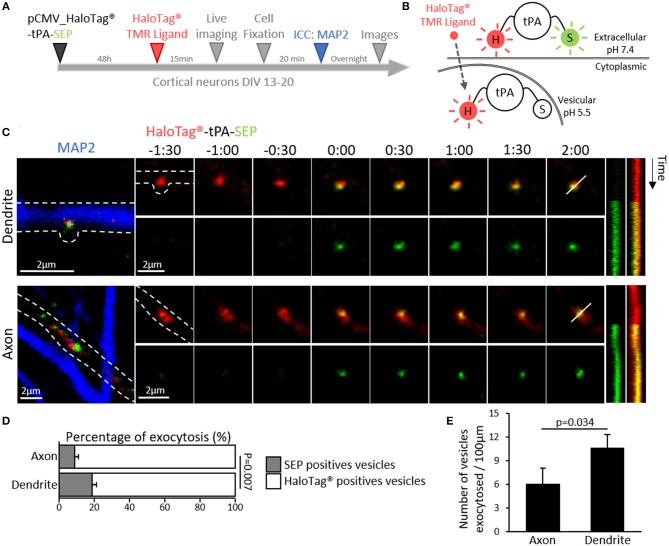
Dendritic and axonal release of tPA. (A) Timeline of the experiment. (B) Schematic diagrams of a dual color reporter for neuronal tPA. tPA fused to a HaloTag® site and the superecliptic pHluorin (SEP) allows simultaneous visualization of total (HaloTag®) and extraneuronal (SEP) tPA molecules. (C) Representative z-stack confocal images of transfected cortical neurons (DIV12) with pCMV_HaloTag®-tPA-SEP plasmid (TMR ligand; in red and SEP; in green), time-lapse were acquired in 2 dimensions every 30 s (t = 0 was assigned of exocytosis; Time is in min:sec). After live imaging ICCs were performed to reveal MAP2 (in blue) and thus to differentiate axons from dendrites (an example of each are shown). Respective kymographs of HaloTag®-tPA-SEP exocytosis are shown. Scale bar represents 2 μm. (D) Histograms show the percentages of exocytotic tPA-containing vesicles (SEP positives puncta, in green) compared to the total pool of tPA-containing vesicles (TMR positives puncta, in red) in axons (9%) and in dendrites (19%) (N = 16 and N = 14 neurons respectively, from N = 7 independent cultures, p = 0.007). (E) Schematic histograms of the number of vesicles exocytosed per 100μm in axons (6) and dendrites (11) (N = 13 and N = 11 neurons respectively, from N = 5 independent cultures, p = 0.034).

