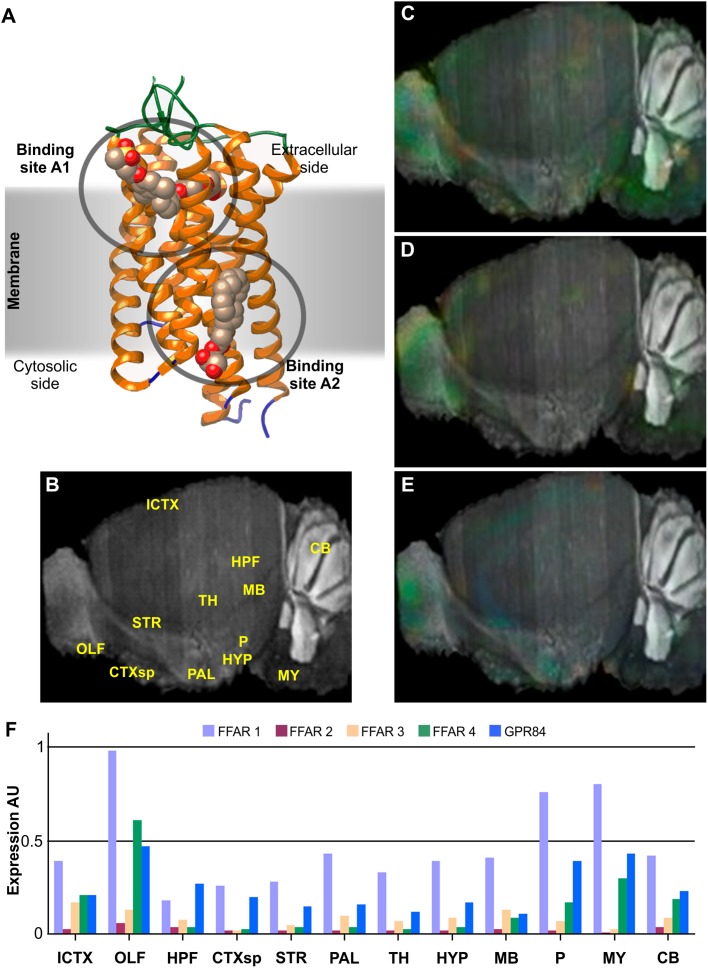
FIGURE 1.
Structure and brain expression patterns of FFARs. (A) Cartoon based on FFAR1 crystal structure (PDB-ID: 4PHU) (Srivastava et al., 2014), highlighting membrane orientation and two ligand binding sites in opposite sides of the membrane. (B) Central brain section of 8-weeks, male mouse (C57BL/6J) indicating reference regions. (C–E) Brain left hemisphere sagittal projection showing expression of FFAR1, FFAR4 and GPR84, respectively, based on in situ hybridization (ISH) data. FFAR2 and FFAR3 are not shown due to its lower expression levels. (F) Quantification of relative expression from ISH data for all FFARs isoforms. AU: Arbitrary units; ICTX: Isocortex; OLF: Olfactory areas; HPF: Hyppocampal formation; CTXsp: Cortical subplate; STR: Striatum; PAL: Pallidum; TH: Thalamus; HYP: Hypothalamus; MB: Midbrain; P: Pons; MY: Medulla; and CB: Cerebellum. Image credit for panels C–E: Allen Institute © 2007 Allen Institute for Brain Science. Allen Mouse Brain Atlas. Available from: http://mouse.brain-map.org/search/. Panels B and F were constructed from data available through Allen Mouse Brain Atlas website.

