FIGURE 3.
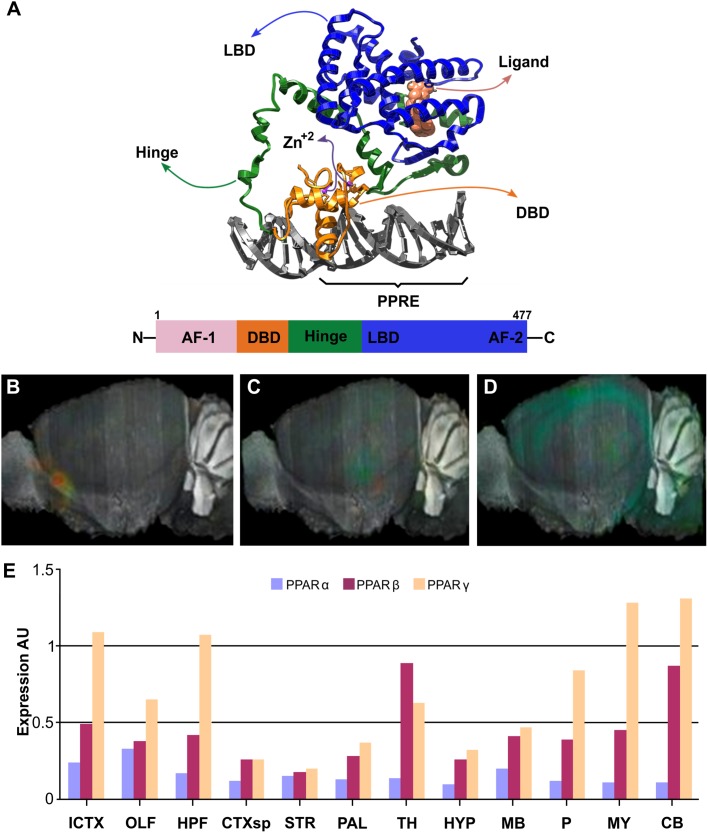
Structure and brain expression patterns of PPARs. (A) Cartoon based on crystal structure (PDB-ID: 3DZY) of the full-length PPARγ in a complex with RXRα and two accessory 13-amino acids peptides of Nuclear receptor coactivator 2 and a dsDNA containing the PPRE (Chandra et al., 2008). For clarity, only PPARγ, its synthetic agonist Rosiglitazone and the dsDNA are shown. N-terminal region of PPARγ is not visible because it was not determined due to high flexibility. (B–D) Brain left hemisphere sagittal projection showing expression of PPARα, PPARβ and PPARγ, respectively based on ISH data. (E) Quantification of relative brain expression from ISH data for neural FABPs isoforms. AU: Arbitrary units. For brain regions references see legend of Figure 1. Image credit for panels B–D: Allen Institute. © 2007 Allen Institute for Brain Science. Allen Mouse Brain Atlas. Available from: http://mouse.brain-map.org/search/. Panel E was constructed from data available through Allen Mouse Brain Atlas website.

