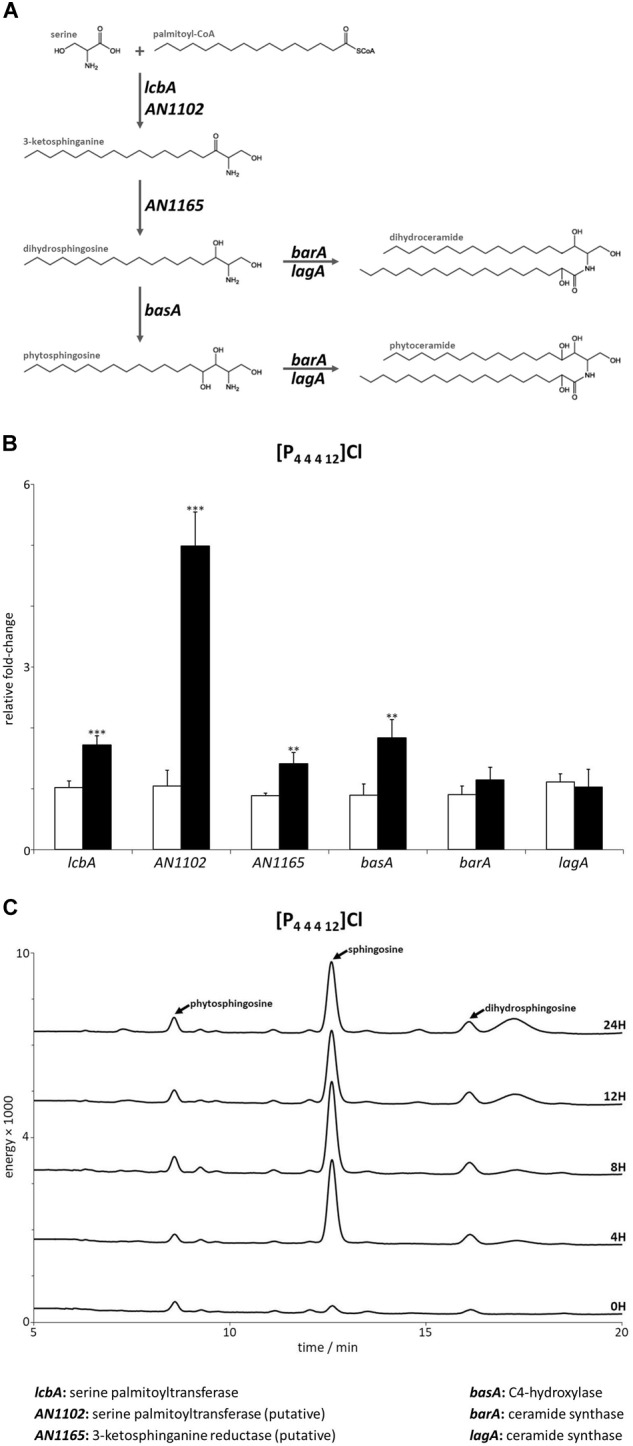
FIGURE 2.

(A) Schematic representation of the first steps in the sphingolipid biosynthetic pathway. (B) Expression levels of the genes mediating the first steps of sphingolipid biosynthesis after 4 h of exposure to dodecyltributylphosphonium chloride ([P44412]Cl, black bars) compared to the control (white bars). Axis y represents the fold-change relative to time-zero (∗∗p < 0.01, ∗∗∗p < 0.001). (C) Sphingoid bases accumulation profile after 4, 8, 12, and 24 h of exposure to [P44412]Cl. The peaks assigned to phytosphingosine, sphingosine and dihydrosphingosine were confirmed by their standards.
