FIGURE 4.

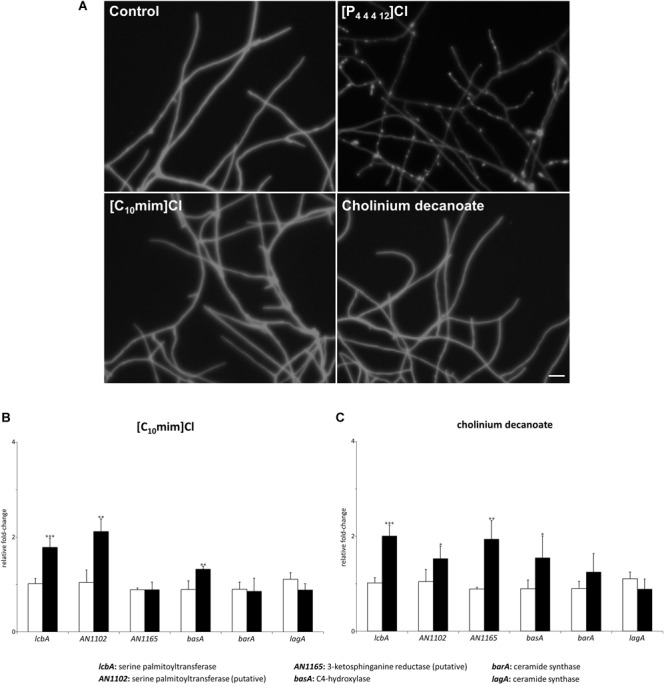
(A) Microscopic images of hyphae exposed to 100 mM of dodecyltributylphosphonium chloride ([P44412]Cl), 1-decyl-3-methylimidazolium chloride ([C10mim]Cl) or cholinium decanoate for 4 h and stained with calcofluor white (scale bar: 25 μM). (B,C) Expression levels of the genes mediating the first steps of sphingolipid biosynthesis after 4 h of exposure to [C10mim]Cl (B, black bars) or cholinium decanoate (C, black bars) compared to the control (white bars). Axis y represents the fold-change relative to time-zero (∗p < 0.05, ∗∗p < 0.01, ∗∗∗p < 0.001).
