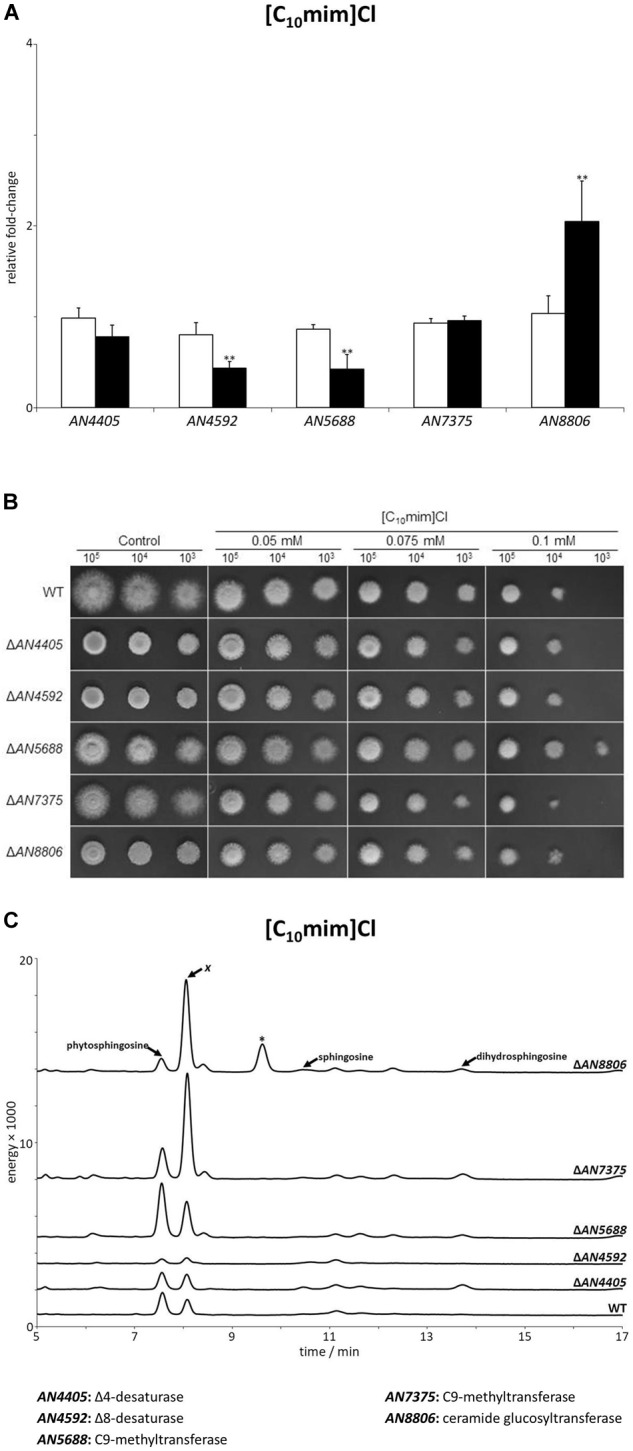
FIGURE 5.

(A) Expression analysis of glucosylceramide pathway genes after 4 h of exposure to 1-decyl-3-methylimidazolium chloride ([C10mim]Cl, black bars), compared to the control (white bars). Axis y represents the fold-change relative to time-zero (∗∗p < 0.01). (B) Growth assessment in solid media supplemented with 0.05, 0.075, or 0.1 mM of [C10mim]Cl. 105, 104, and 103 conidia were inoculated in each plate. (C) Sphingoid bases accumulation profile of glucosylceramide pathway mutants and parental strain (wt) after 4 h of exposure to [C10mim]Cl. The peaks assigned to phytosphingosine, sphingosine and dihydrosphingosine were confirmed by their standards. The peak marked with an asterisk likely corresponds to 9-methyl-4,8-sphingadiene (more details in Supplementary Figure S5).
