FIGURE 1.

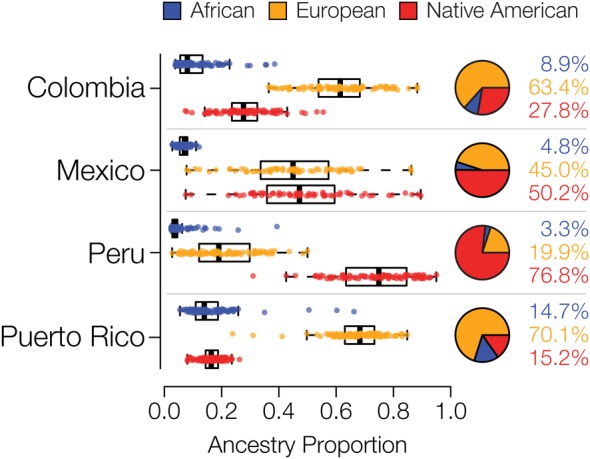
Genetic ancestry proportions for the admixed Latin American populations studied here. For each population, distributions and average values are shown for African (blue), European (orange), and Native American (red) ancestry.

Genetic ancestry proportions for the admixed Latin American populations studied here. For each population, distributions and average values are shown for African (blue), European (orange), and Native American (red) ancestry.