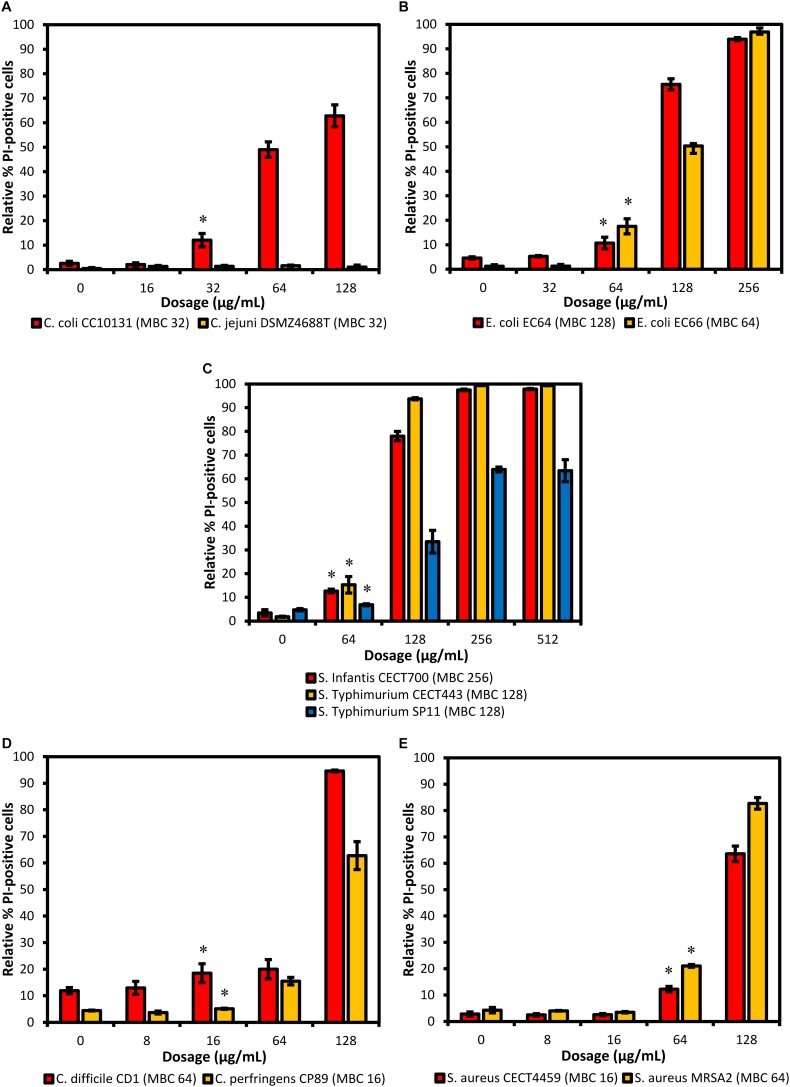
FIGURE 1.
Proportion of cells stained with PI (altered membrane permeability) detected using FC after 90 min of exposure to different concentrations of BIOCITRO® (half the lowest, the lowest, the highest, and twice the highest MBC of each genus). Data show the averages of the three independent replicate experiments for each strain grouped by genus: (A) Campylobacter, (B) E. coli, (C) S. enterica ssp. enterica, (D) Clostridium, and (E) S. aureus. The differences between the average of damaged cells of each treatment with regard to the control (without product) were significant for the concentrations marked with ∗ and higher.

