FIGURE 3.
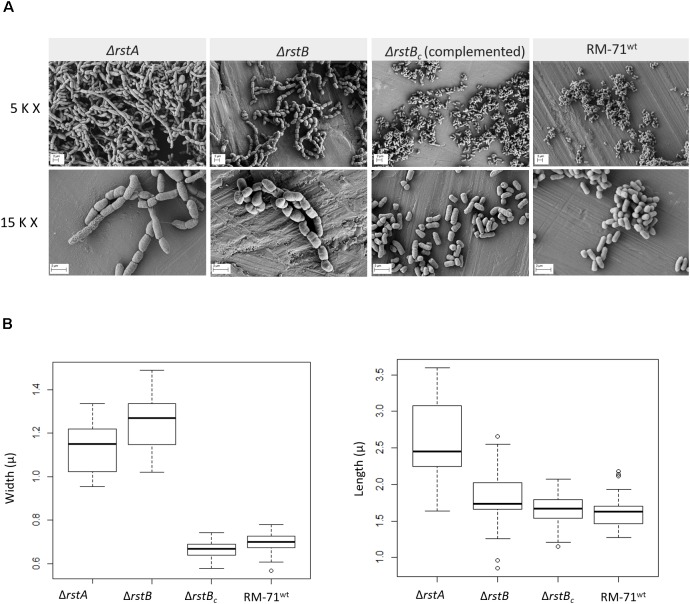
(A) Scanning electron microscopy of P. damselae subsp. damselae parental strain RM-71, ΔrstA and ΔrstB mutants, and complemented rstB mutant (MT157), grown at 25°C in TSB with 0.5% NaCl. Note the enlarged cell size of the mutants, which also form chain-like structures likely due to an impairment in daughter cell separation upon cell division. Pictures from two magnifications, 5,000 × (5 K X) and 15,000 × (15 K X) are shown, and scale bars representing 2 μm are included in each picture. (B) Box plot graphs showing the comparison of cell width and cell length in exponential phase cultures. Whiskers indicate min and max values.

