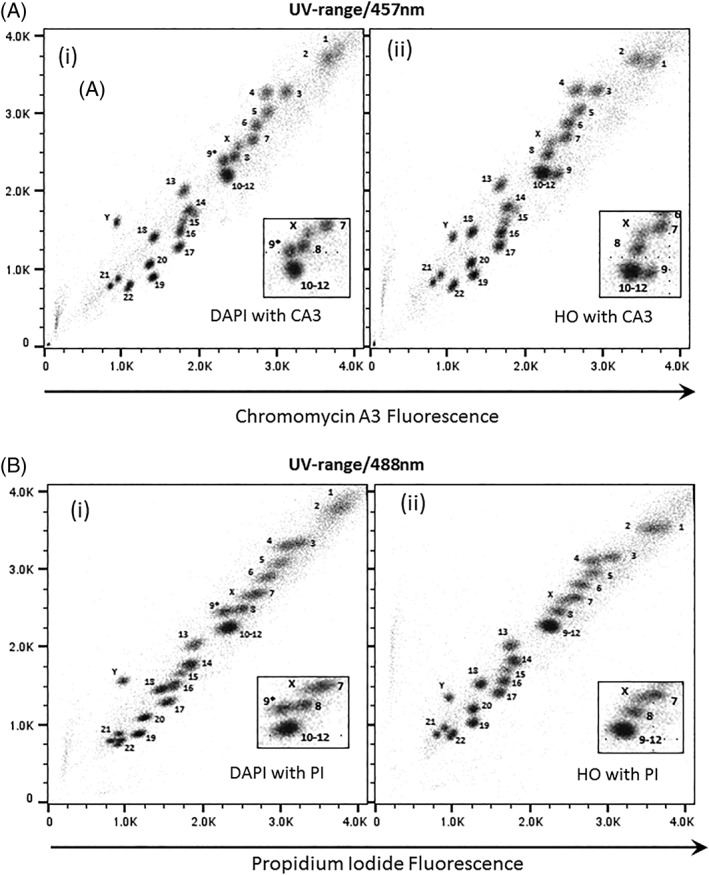
Figure 1.

Bivariate flow karyotypes plot of chromosomes from a normal male human lymphoblastoid cell line, GM7016A. Chromosomes were stained with different dye combinations acquired from sorter MOFLO Legacy with AT‐specific stain fluorescence on the y‐axis. (A) Lasers settings of 300 mW UV to excite DAPI (i) or HO (ii) and 457 nm to excite CA3. (B) Lasers settings of 300 mW UV to excite DAPI (i) or HO (ii) and 488 nm at 200 mW to excite PI. The inset panel shows the 9–12 cluster in more detail. The unexpected chromosome peak is indicated (9*).
