
Figure 2.
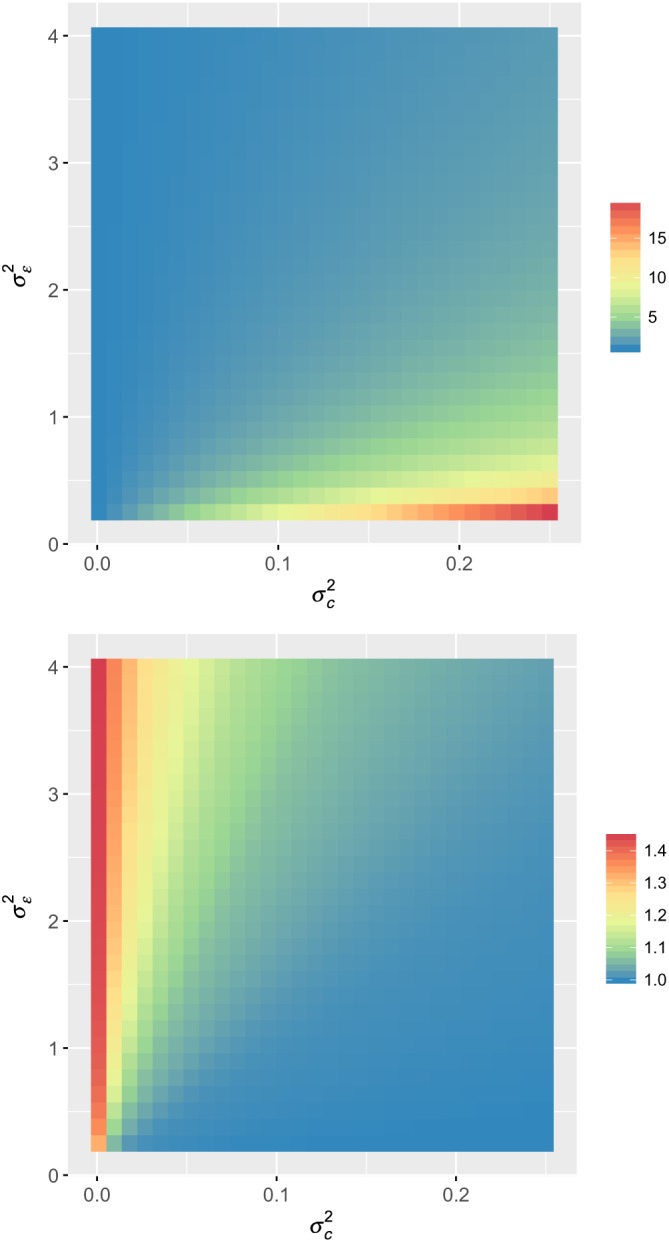
The ratio of the variance of the intervention effect when using design matrices X 1 (top) and X 2 (bottom) relative to the optimal design (given in Figure 1) is shown for a range of possible combinations of [Colour figure can be viewed at wileyonlinelibrary.com]