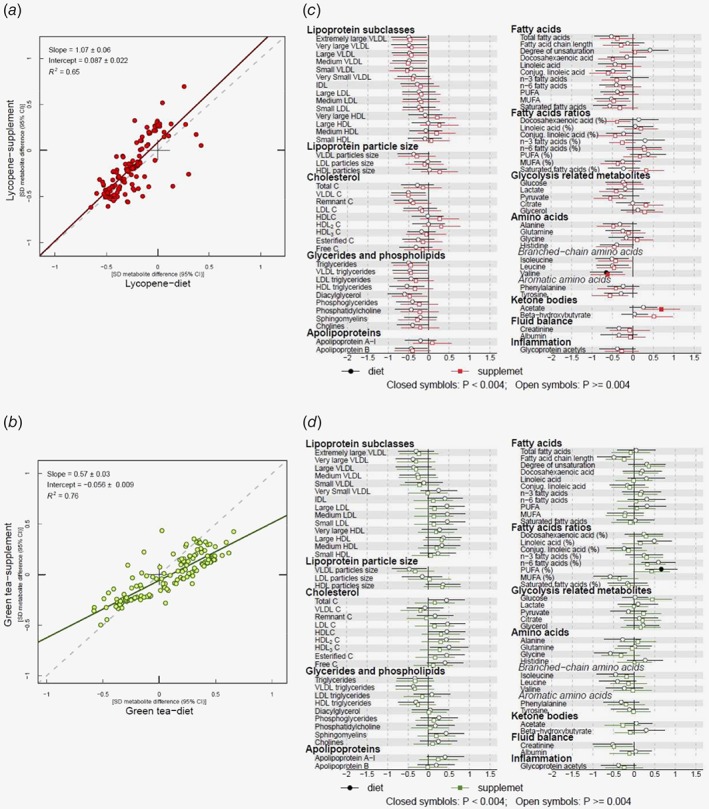
Figure 3.

(a) Comparison of overall effects on serum metabolic traits between lycopene intervention arms vs. placebo models. Estimates of the standard deviation (SD) difference in metabolic trait concentration between lycopene dietary advice and placebo arms at follow‐up (x‐axis) plotted against the SD difference in metabolic trait concentration in the lycopene supplement arm vs. placebo (y‐axis). (b) Comparison of overall effects on serum metabolic traits between green tea intervention arms vs. placebo models. Corresponding results for green tea. Each dot on plots A and B represents an individual metabolic trait. A linear fit of the overall correspondence summarises the similarity in magnitude between diet and supplement associations (solid lines). A slope of 1 with an intercept of 0 (dashed lines), with all dots sitting on that line (R 2 = 1), would indicate that diet and supplement estimates had the same magnitude and direction. Corresponding results for green tea. (c) SD follow−up metabolic trait concentration difference between lycopene diet or supplement vs. placebo. (d) SD follow−up metabolic trait concentration difference between green tea diet (drink) or supplement vs. placebo. Circles indicate β‐regression coefficients for the dietary intervention arms. Squares indicate β‐regression coefficients for the supplement arms. Closed symbols denote values that reached the threshold for multiple testing (p ≤ 0.004). Association magnitudes are in units of 1‐SD metabolic measure concentration. Horizontal bars represent 95% confidence intervals. Abbreviations: C, cholesterol; HDL, high‐density lipoprotein; IDL, intermediate‐density lipoprotein; LDL, low‐density lipoprotein; MUFA, monounsaturated fatty acids; PUFA, polyunsaturated fatty acids; VLDL, very‐low‐density lipoprotein.
