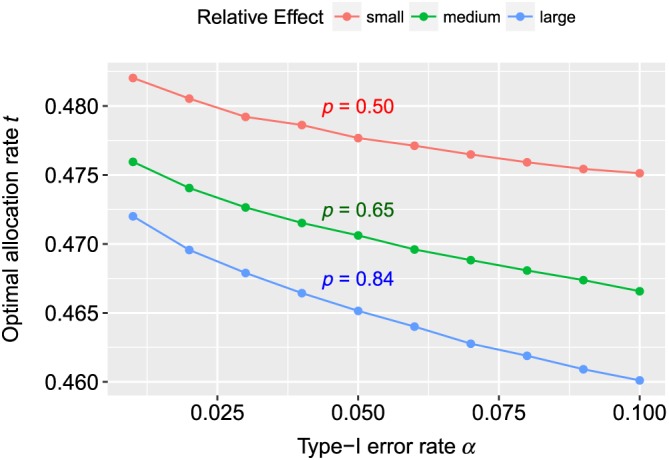
Figure 1.

The graphic shows the values of the optimal allocation rate t 0 for different values of type‐I error rates α where the goal is to detect a relevant effect with at least 80% power. For the reference group, we used Beta(5,5) distributions, and for the treatment group, we assumed Beta(3,i), where i = 1,2,3. The red line represents i = 3 (relative effect p≈0.5); for the green curve, we have used i = 2 ( p≈0.65), and for the red line, i = 1 ( p≈0.84) [Colour figure can be viewed at wileyonlinelibrary.com]
