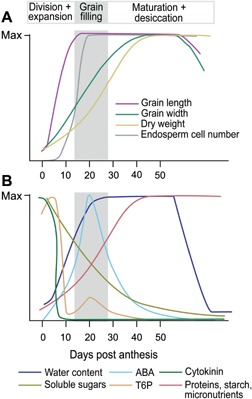
Figure 2.

Dynamics of grain dimensions and contents during wheat grain development Schematic summarizing the changes in wheat grain weight and dimensions (A) and grain contents (B) across development, expressed as days post‐anthesis (dpa). Curves show the level of each parameter relative to the maximum level at any point during grain development. Shading indicates the phases of grain development: Division + expansion (0–14 dpa), Grain filling (14–28 d) and Maturation + desiccation (28 dpa onwards; from Shewry et al. 2012). ABA = abscisic acid, T6P = trehalose 6‐phosphate. Data summarized from (Sofield et al. 1977; Rogers and Quatrano 1983; Dominguez and Cejudo 1996; Hess et al. 2002; Nadaud et al. 2010; Martínez et al. 2011; Shewry et al. 2012; Xie et al. 2015).
