Figure 3.

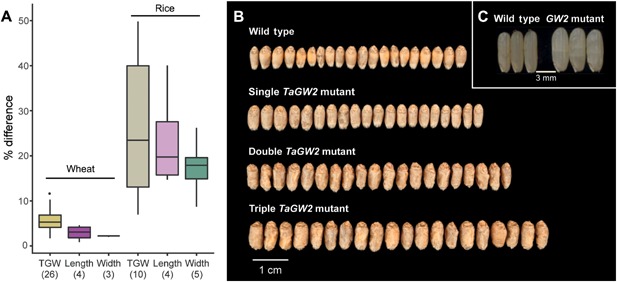
Genetic control of grain weight in wheat (A) The percentage effect of quantitative trait loci (QTL) for grain weight (measured as thousand grain weight; TGW), length and width in wheat and rice. The effect of single grain weight QTL in wheat is usually <10%, whereas in rice the effects are larger (mean = 25.9%). Values in brackets are the number of different QTL used to create the boxplots. Data used detailed in Table 1. (B) Effects of deleterious mutations in TaGW2 (adapted from Wang et al. 2018b). Twenty representative grains are shown for each line. Combining mutations in multiple homoeologs has an additive effect on TGW compared to the wild type (single = 5.3%, double = 10.5%, triple = 20.7%) suggesting that there is functional redundancy amongst TaGW2 homoeologs. (C) Effect of a natural loss of function mutation of GW2 in rice (adapted from Song et al. 2007). This loss of function mutation results in both increased grain weight (49.8%) and grain width (26.2%) compared to the wild type.
