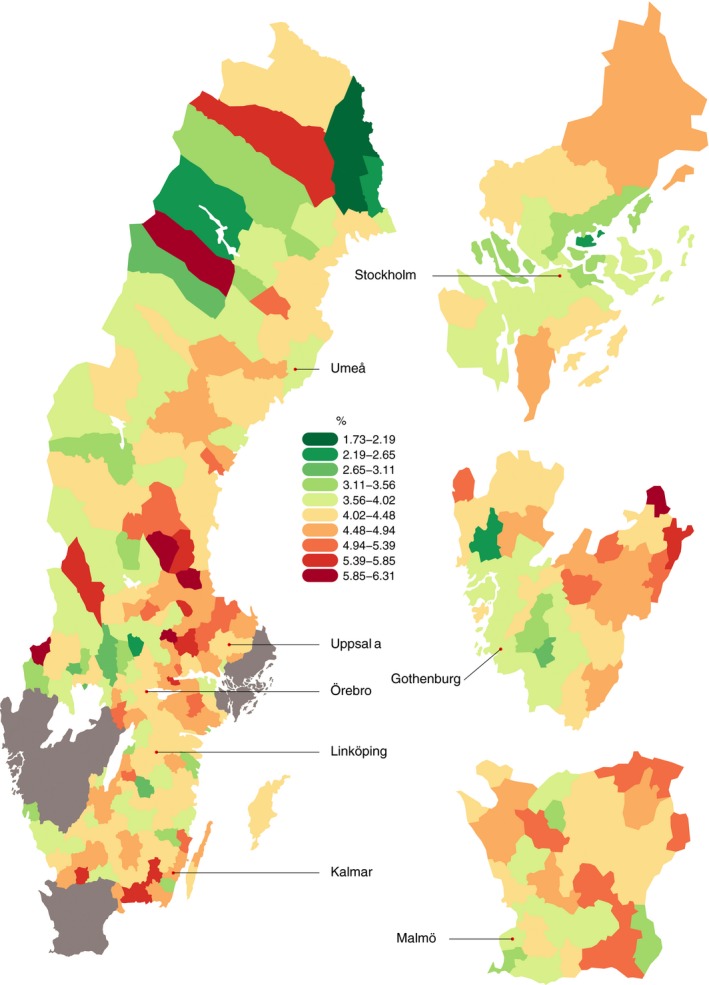
Figure 3.

Preterm delivery rates across Sweden adjusted for known risk factors from a multiple linear regression model (both spontaneous and iatrogenic deliveries are included) [Color figure can be viewed at wileyonlinelibrary.com]

Preterm delivery rates across Sweden adjusted for known risk factors from a multiple linear regression model (both spontaneous and iatrogenic deliveries are included) [Color figure can be viewed at wileyonlinelibrary.com]