Figure 4.

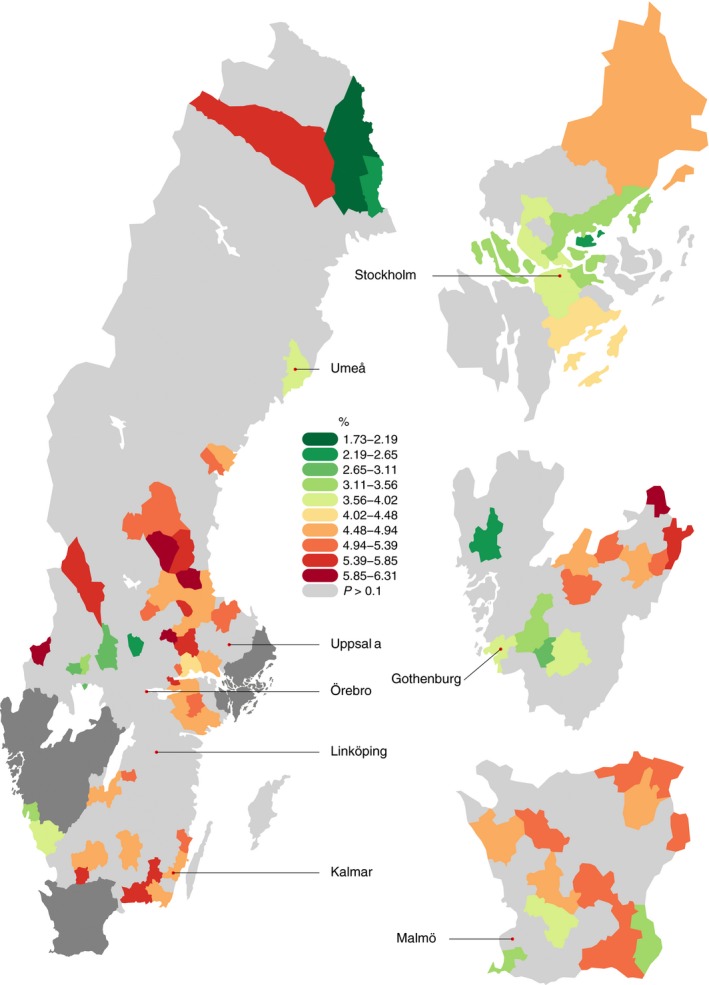
Preterm delivery rates significantly higher or lower than the population mean preterm delivery rate (binomial test P < 0.1, no multiple testing adjustment) [Color figure can be viewed at wileyonlinelibrary.com]

Preterm delivery rates significantly higher or lower than the population mean preterm delivery rate (binomial test P < 0.1, no multiple testing adjustment) [Color figure can be viewed at wileyonlinelibrary.com]