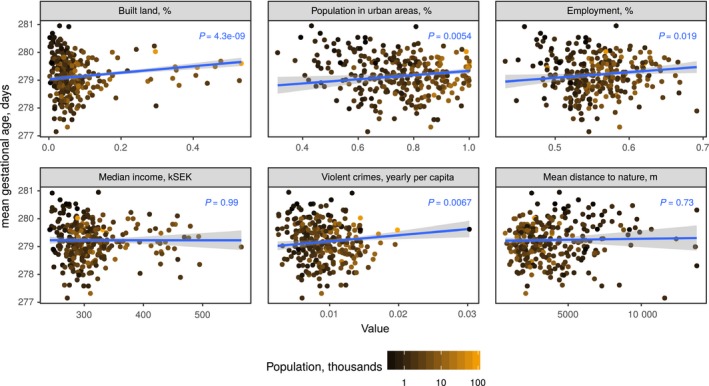
Figure 5.

Weighted linear regression plots of environmental and socioeconomic municipality features and gestational age. Points represent municipalities, weighted by their number of deliveries (N) [Color figure can be viewed at wileyonlinelibrary.com]
