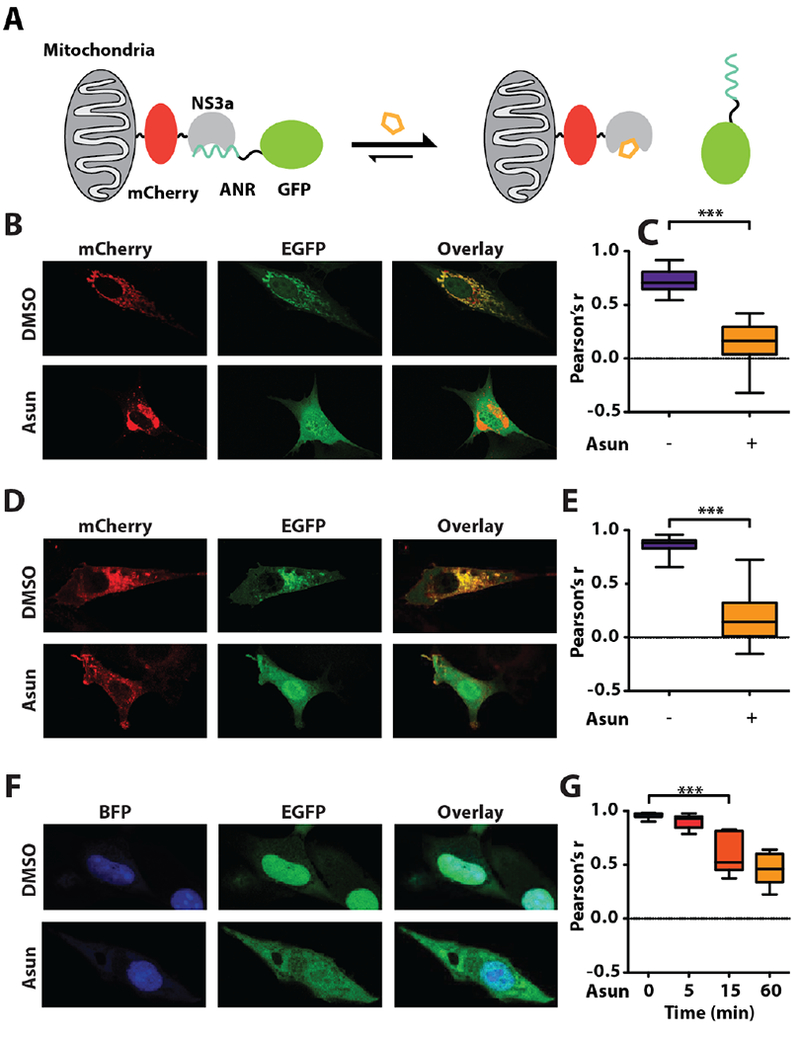
Figure 3.

CDP control of protein localization. (A) Schematic of the mitochondrial colocalization assay. (B) Representative images of cells expressing mitochondrially-localized NS3a(H1) (Tom20-mCherry-NS3a(H1)) and EGFP-ANR2 treated with DMSO or asunaprevir (Asun) for 5 min. (C) Quantification of EGFP and mCherry colocalization in DMSO and Asun-treated cells. (D) Representative images of cells expressing membrane-localized ANR (myr-mCherry-ANR2) and EGFP-NS3a(H1) treated with DMSO or Asun for 15 min. (E) Quantification of EGFP and mCherry colocalization in DMSO and Asun-treated cells. (F) Representative images of cells expressing nuclear-localized ANR (NLS3-BFP-ANR2) and EGFP-NS3a(H1) treated with DMSO or Asun. (G) Quantification of EGFP and BFP colocalization in cells treated with Asun for the times shown. Quantification details and statistical analyses provided in Figure S12.
