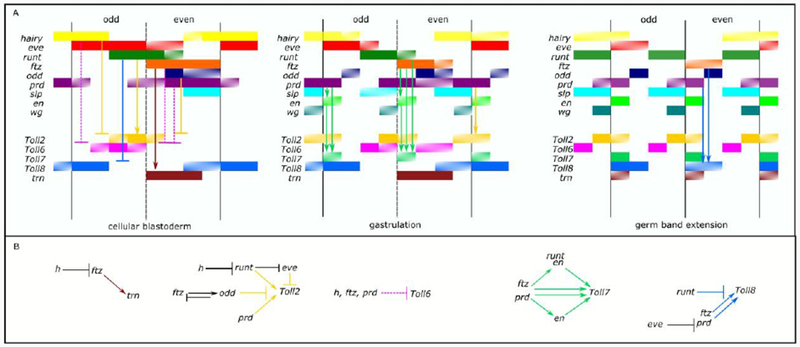
Figure 7.

The relationships between the PRGs and the sLRR genes are complex and suggest that multiple PRGs regulate each sLRR gene. A) Schematic representation of PRG and sLRR-encoding gene expression. The diagrams, using the format of Clark and Akam (Clark and Akam, 2016), represent snapshots of a continuously evolving pattern at cellular blastoderm, gastrulation and germ-band extension. Gene expression is indicated by a colored bar to the right of the gene name: hairy (yellow), eve (red), run (dark green), ftz (orange), odd-skipped (dark blue), paired (purple), sloppy-paired (light blue), engrailed (light green), wingless (blue-green), Toll2 (gold), Toll6 (pink), Toll7 (medium green), Toll8 (medium blue), trn (brown). Patterned bars represent rapidly changing expression. The black vertical lines represent the eventual position of the parasegment boundaries. Arrows or T-bars represent possible activation or repression respectively. Solid arrows or T-bars indicate possible direct regulations. Interactions affecting the primary Toll stripes are shown in the cellular blastoderm panel while those affecting the secondary Toll stripes are diagramed in the gastrulation or germband extended panel. Arrow color matches that of the Toll gene affected. B) Regulatory relationships between PRGs and sLRR genes. The diagrams show proposed regulatory interactions between PRGs and sLRR-encoding genes. PRGs that activate primary sLRR stripes are located above the sLRRs. PRGs that activate secondary sLRR stripes are located below the sLRRs. PRGs that repress sLRR stripes are on the same level as the sLRR. Previously described regulatory relationships are shown as black arrows or bars.
