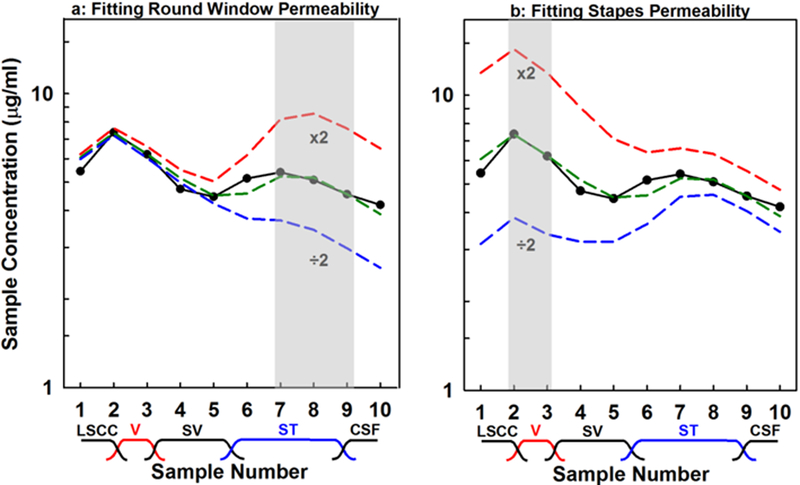
Figure 4:
Summary of how calculated sample curves are fitted to measured data (black curve), in this case for dexamethasone-phosphate in liquid form. (a) The variable representing round window permeability in the model is adjusted to match calculated samples 7–9 to the measured values, which in this case required a value of 28.0 × 10⁻⁹ m/s. The influence of doubling and halving the permeability are also shown. (b) Similar adjustment of the variable representing stapes permeability to match calculated samples 2–3 to the measured data. Subsequent samples are influenced by the change, because they have to pass through the vestibule during the sequential sampling procedure.

