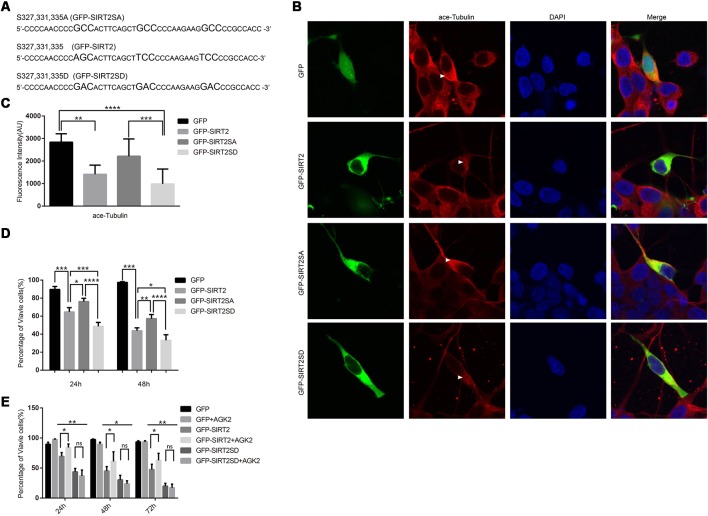
Figure 4.
A SIRT2 phosphorylation mimic enhanced SIRT2 cytotoxicity. (A) GFP-SIRT2 is the wild-type plasmid DNA sequence, GFP-SIRT2SA is the dephosphorylation mimic sequence, and GFP-SIRT2SD is the phosphorylation mimic sequence. (B) Fluorescence images showing ace-tubulin expression in cells transfected with GFP, GFP-SIRT2, GFP-SIRT2SA or GFP-SIRT2SD; the fluorescence intensity of ace-tubulin is shown in red (arrowheads). (C) A histogram representing the fluorescence intensity of ace-tubulin immunofluorescence in cells transfected with GFP, GFP-SIRT2, GFP-SIRT2SA or GFP-SIRT2SD (**p < 0.01, ***p < 0.001, ****p < 0.0001, one-way ANOVA followed by Tukey’s post hoc test). (D) A histogram representing the percentage of viable cells. The percentage of viable cells in GFP-, GFP-SIRT2-, GFP-SIRT2SA- or GFP-SIRT2SD-transfected cells was calculated after 24 and 48 h (**p < 0.01, ***p < 0.001, ****p < 0.0001, two-way ANOVA followed by Tukey’s post hoc test). (E) A histogram representing the percentage of viable cells. AGK2 was added after the cells were transfected for 24 h. The percentage of viable cells was calculated 24 h, 48 h and 72 h after the addition of AGK2 (*p < 0.05, **p < 0.01, two-way ANOVA followed by Tukey’s post hoc test). The values are expressed as the mean ± SD, n ≥ 3 for each group (*p < 0.05, **p < 0.01, ***p < 0.005, ns, not statistically significant; two-tailed Student’s t-test).

