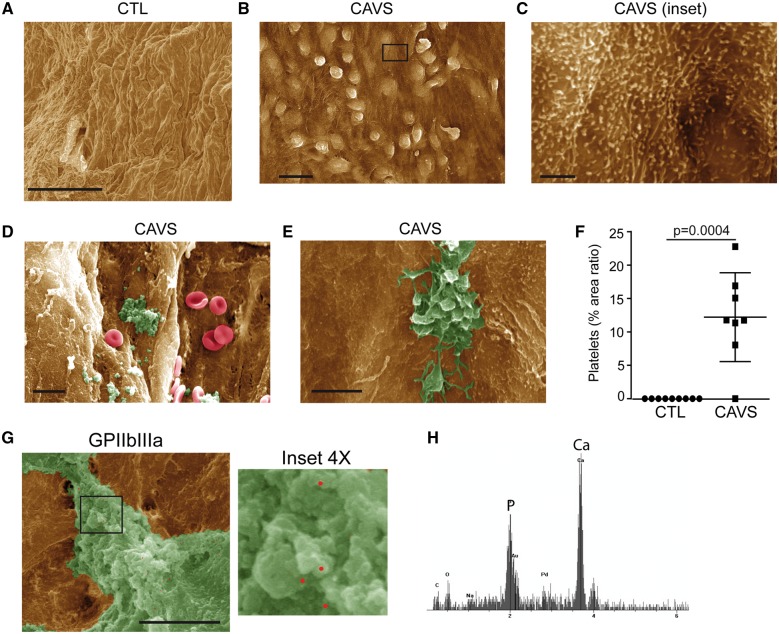
Figure 1.
Activated platelets in mineralized aortic valves. (A–E) Scanning electron microscope analyses of control (n = 9) (A) and mineralized (n = 8) (B–E) valves showing activation of endothelium (B and C) platelets aggregates and red blood cells (D and E). (F) Quantification of platelets in control (n = 9) vs. calcific aortic valve stenosis (n = 8). (G) Immunogold labelling for glycoprotein IIb/IIIa confirming the presence of platelet aggregates on calcific aortic valve stenosis. (H) Energy-dispersive X-ray spectroscopy analysis of platelet aggregates, demonstrating the presence of calcification. Scale bars: (A and B) 20 µM, (C) 2 µM, (D) 10 µM, (E) 5 µM, (G) 4 µM. Values are presented as mean ± standard deviation. CAVS, calcific aortic valve stenosis; CTL, control; GPIIb/IIIa, glycoprotein IIb/IIIa.

