
Figure 5.
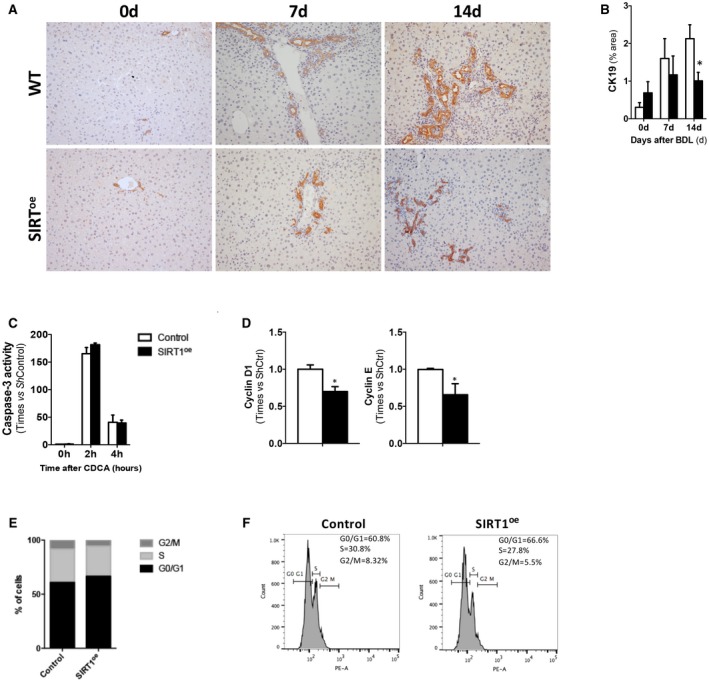
SIRT1 overexpression correlates with attenuation of cholangiocyte proliferation. (A) IHC using an anti‐CK19 Ab in paraffin‐embedded liver sections at different time points after BDL and (B) further quantification using Frida software, expressed in % of positive staining ppf (original magnification, ×10) showing milder ductular reaction in SIRT mice compared to WTs. (C) Determination of caspase‐3 activity in response to CDCA on NMCs transfected with control c‐Flag pcDNA3 (Ctrl) or pCruzHA SIRT1 plasmid DNA to induce overexpression of SIRT1 (SIRToe). (D) qPCR analysis of cell‐cycle–related gene expression in Ctrl and SIRToe transfected NMC showing lower proliferation in the presence of growth factors (EGF) 36 hours after transfection. (E) FACS analysis of PI‐stained NMCs confirming lower numbers of cells in S phase after SIRT1 overexpression compared to control transfected cells. (F) Representative histograms after FACS analysis of NMC transfected cells in culture. Values are mean ± SD; n = 5 animals/time point; in vitro experiments were performed three times in triplicate; *P < 0.05; **P < 0.01 (WT vs. SIRT); (Ctrl vs. SIRT1oe). Abbreviations: Ab, antibody; EGF, epidermal growth factor; PI, propidium iodide; ppf, per power field; ShCtrl, short hairpin control.