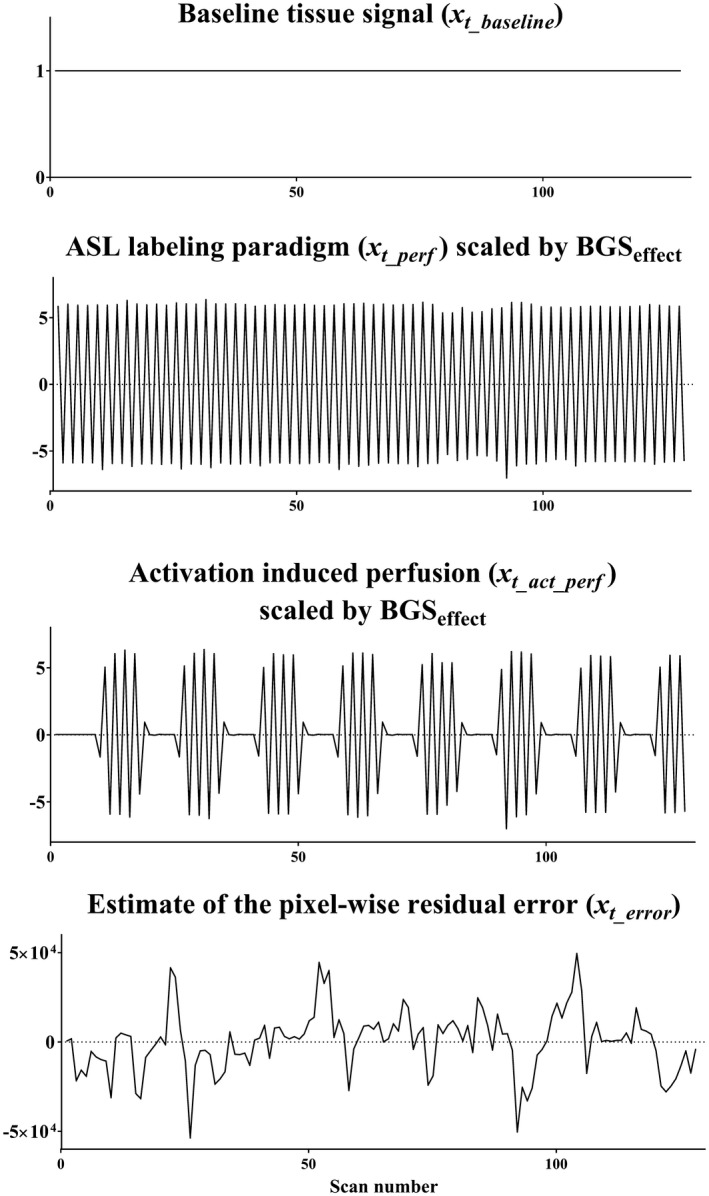
Figure 3.

An example of the design matrix used to the in vivo ASL‐FMRI study, in which xt_baseline = 1 for baseline tissue signal, xt_perf represents the signal changes as a result of the ASL labeling paradigm, and xt_act_perf describes the ASL signal changes induced by activation. Because the perfusion‐weighted signal is scaled by the BGSeffect during the homogenization process, xt_perf and xt_act_perf were multiplied by the resliced BGSeffect that was generated at the second step to include the pixel‐by‐pixel scaling of the perfusion‐weighted signal. xt_errorrepresents an estimate of the pixel‐wise residual error
