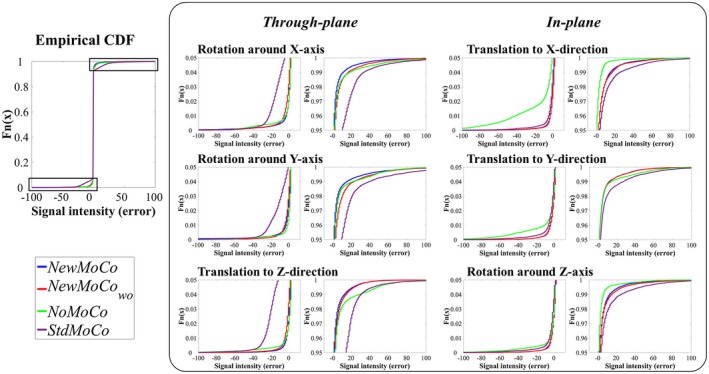
Figure 6.

The empirical cumulative distribution function (CDF) of the signal intensity in the right side of the brain (without perfusion) obtained from simulation 2, which indicates the level of artefactual signal that arises mostly from conventional subtraction errors because of motion as well as the above‐mentioned BGS subtraction errors. The value is ideally close to zero when both sources of errors are well corrected. For magnified presentation, only plots with the cumulative distribution from 0–0.05 and 0.95–1.00 and signal intensity between −100 to 100 are shown
