
Figure 7.
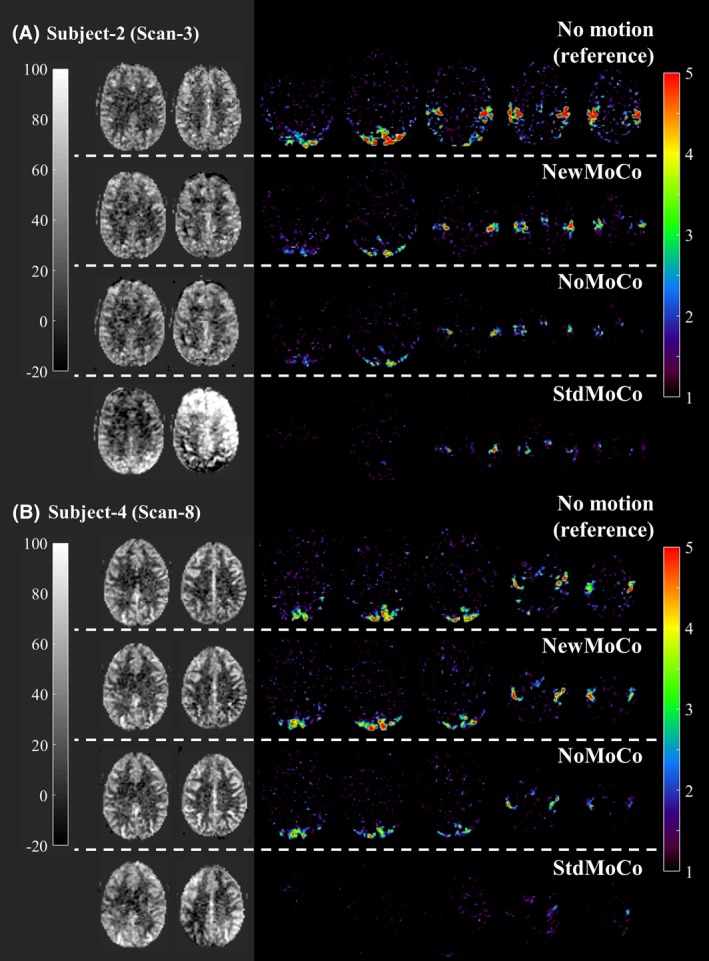
Representative baseline CBF maps and t‐value maps showing the activated regions by the visual stimulus and finger tapping obtained from the ASL‐FMRI study with intentional head movements processed by NewMoCo, NoMoCo, and StdMoCo. As reference, maps acquired without intentional head movement are also shown on top of them