Figure 8.

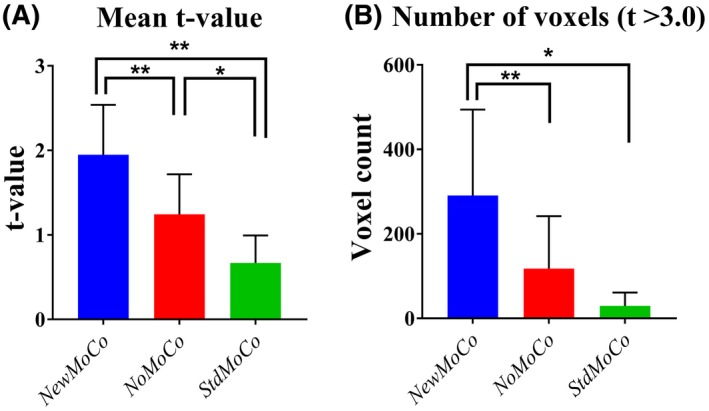
The results of the ROI analysis from all scans. (A) Mean t‐values and (B) number of voxels that exhibited a t‐value >3.0 from data set processed by NewMoCo, NoMoCo, and StdMoCo

The results of the ROI analysis from all scans. (A) Mean t‐values and (B) number of voxels that exhibited a t‐value >3.0 from data set processed by NewMoCo, NoMoCo, and StdMoCo