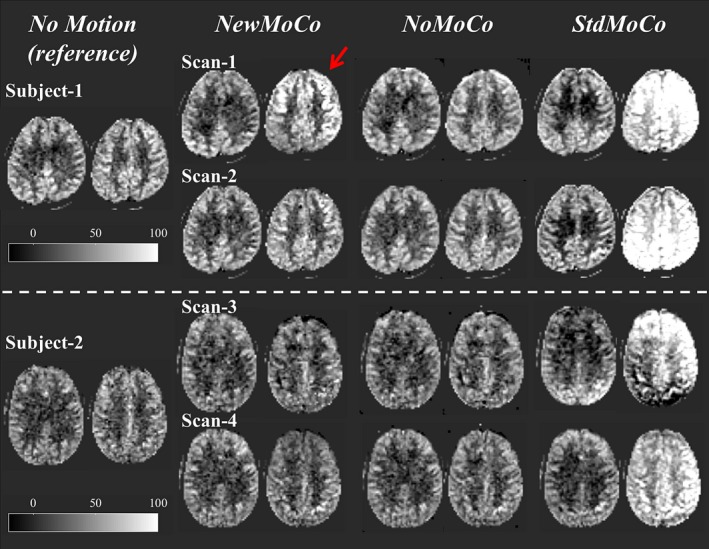
Figure 9.

The baseline CBF maps from the subjects 1 and 2 (subjects 3 and 4 are shown in Figure 10) showing 2 slices with largest difference of BGS efficiency from the neighboring slices. Red arrows indicate the residual error from 2 scans with the most severe head‐motion
