
Figure 1.
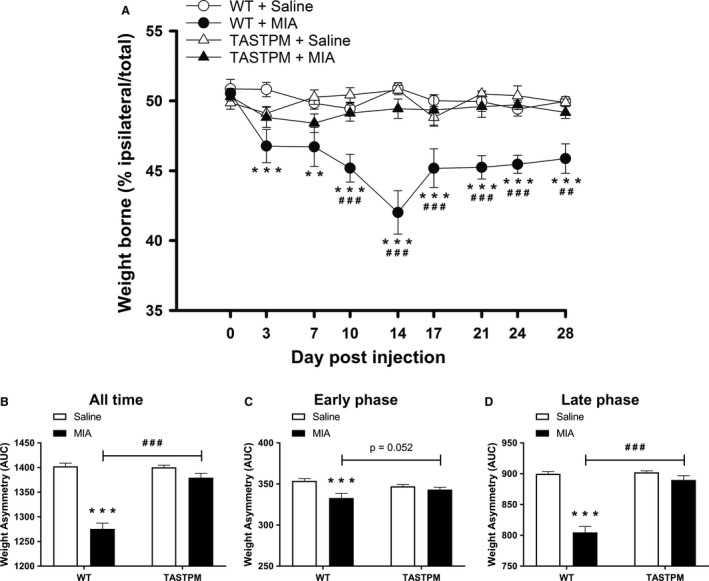
MIA‐induced weight asymmetry absent in TASTPM mice. Weight borne on ipsilateral hind limb, calculated as percentage of ipsilateral weight borne/total weight borne (ipsilateral + contralateral weight borne), by 6 months old TASTPM and age‐ and gender‐matched wild‐type (WT), was monitored at regular intervals prior to (baseline, 0) and up to 28 days post‐intra‐articular administration of MIA (1 mg/10 μL) or saline (control) into the left knee joint (A). Alteration in weight distribution was compared between experimental groups within genotype (**p < 0.01, ***p < 0.001) and between genotype within experimental group (## p < 0.01, ### p < 0.001) was detected using two‐way repeated measures ANOVA followed by the Student–Newman–Keuls post hoc test. The number of male and female per experimental group: WT + Saline (n = 10: five males and five females); WT + MIA (n = 8: four males and four females); TASTPM + Saline (n = 8: four males and four females); and TASTPM + MIA (n = 10: five males and five females). As no difference in thresholds was observed, prior to or at regular intervals post‐MIA administration, between male and female in both WT and TASTPM mice, the data were pooled. Data are as mean weight borne ± SEM (n = 8–10 mice per experimental group). Area under the curve (AUC) analysis was calculated and expressed as weight asymmetry where a lower value represents more severe weight asymmetry. All time is the analysis of AUC for baseline – day 28 (B), early phase (baseline – day 7) (C) and late phase (day 10 – day 28) (D). Statistical comparisons between experimental groups within genotype (***p < 0.001) and between genotype within experimental group (### p < 0.001) were conducted using two‐way ANOVA followed by the Student–Newman–Keuls post hoc test. All values are expressed as mean ± SEM (n = 8–10 mice per experimental group).