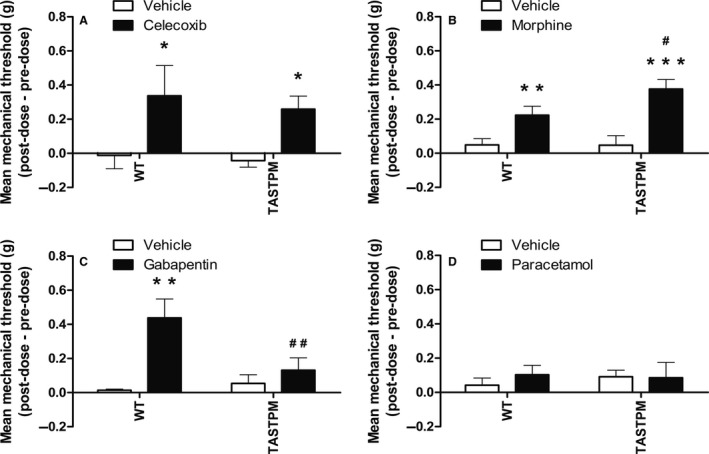
Figure 7.

Altered analgesic responses in TASTPM Mice. Mechanical withdrawal thresholds of MIA‐injected mice were assessed prior to and at specified intervals post‐analgesic or vehicle administration. Both wild‐type (WT: three males and three females per treatment group) and TASTPM (four males and four females per treatment group) mice exhibited increase in mechanical thresholds 1 h post‐oral (p.o.) administration of celecoxib (30 mg/kg) on 6–7 days post‐MIA injection compared to their respective vehicle (methyl cellulose) controls (*p < 0.05) (A). Administration of morphine (6 mg/kg; s.c.), an opioid agonist, on 28 days after MIA injection resulted in significant reversal of mechanical hypersensitivity in both WT (4 males and 4 females per treatment group) and TASTPM (five males and five females per treatment group) mice (1 h post‐injection; **p < 0.01; ***p < 0.001) compared to their respective vehicle (saline) controls, with greater degree of analgesia observed in TASTPM compared to WT mice (# p < 0.05) (B). Gabapentin (60 mg/kg; p.o.; 22–24 days post‐MIA) was only effective in reversing MIA‐induced mechanical hypersensitivity in WT (five males and three females per treatment group) mice (**p < 0.01; 3 h post‐injection), with no effect detected in TASTPM (five males and four females per treatment group) (p > 0.05), compared to their respective vehicle (dH2O) controls. The analgesic effect of gabapentin was significantly greater in WT mice compared to TASTPM (## p < 0.01) (C). Paracetamol (300 mg/kg; p.o.) was ineffective in alleviating MIA‐induced mechanical hypersensitivity (p > 0.05) in both WT (Vehicle: three males and three females; Paracetamol: three male and two females) and TASTPM (Vehicle: two male and three females: Paracetamol: five males and four females) mice when administrated 28 days after MIA injection (30 min post‐injection), compared to their respective vehicle (saline) control group (D). Statistical analysis was conducted using two‐way ANOVA followed by the Student–Newman–Keuls post hoc test. Data are presented as difference between post‐dose and pre‐dose 50% PWT values that are illustrated as mean ± SEM (n = 5–10 mice per experimental group).
