
Figure 2.
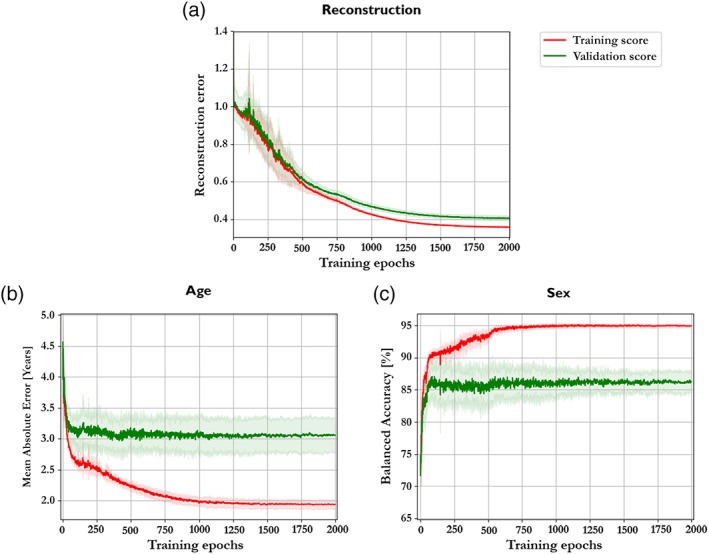
(a) The mean learning curve of the best structure (100–75–100) along the 10‐fold cross‐validation. (b) The mean absolute error curve of age prediction of the best configuration along the 10‐fold cross‐validation. (c) The balanced accuracy curve of sex prediction of the best configuration along the 10‐fold cross‐validation [Color figure can be viewed at http://wileyonlinelibrary.com]