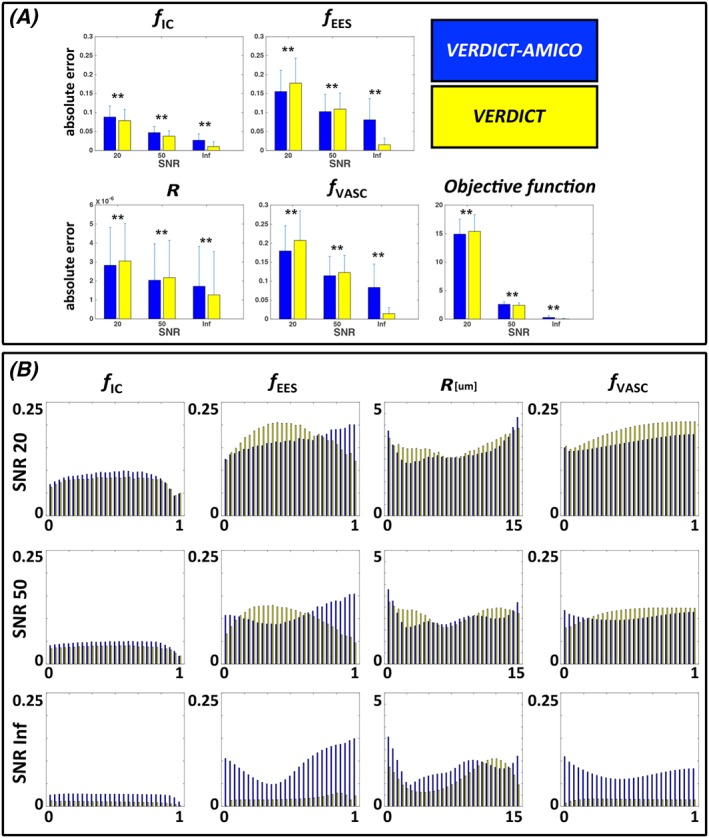
Figure 2.

Quantitative evaluation using synthetic data. Performance comparison of the two fitting implementations of VERDICT as a function of SNR for the synthetic data. A, Mean absolute error obtained with both models with respect to the ground‐truth. Bars are the standard deviations of the errors. B, Absolute errors for each estimated parameter as a function of original synthetic values. fIC, intracellular volume fraction; fEES, extracellular‐extravascular volume fraction; R, radius [μm]; fVASC, vascular volume fraction
