
Figure 6.
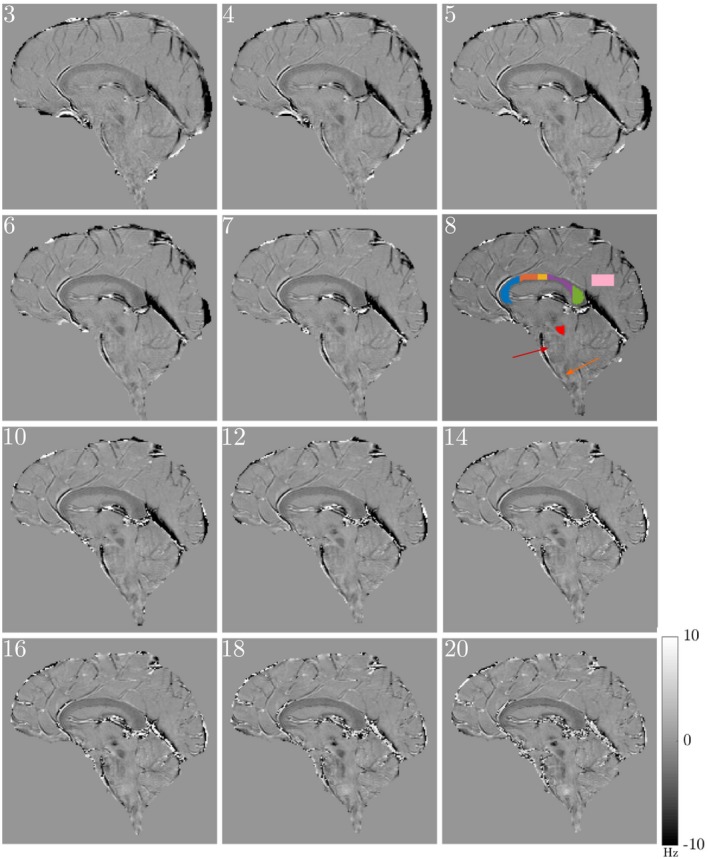
Evolution of the frequency difference with TE (echo number is indicated in the top left corner of each image) in data from a single subject starting from . ROIs are marked on the frequency difference map at . The red and yellow arrows highlight the pons and medulla oblongata, respectively. The 5 different regions of the CC used in subsequent analysis are indicated as genu (blue), anterior body (orange), middle body (yellow), posterior body (purple), and splenium (green). The red and pink shaded regions indicate the superior cerebellar peduncle and gray matter region used in further analysis. Corresponding magnitude images are shown in Supporting Information Figure S3. All frequency difference maps are scaled between