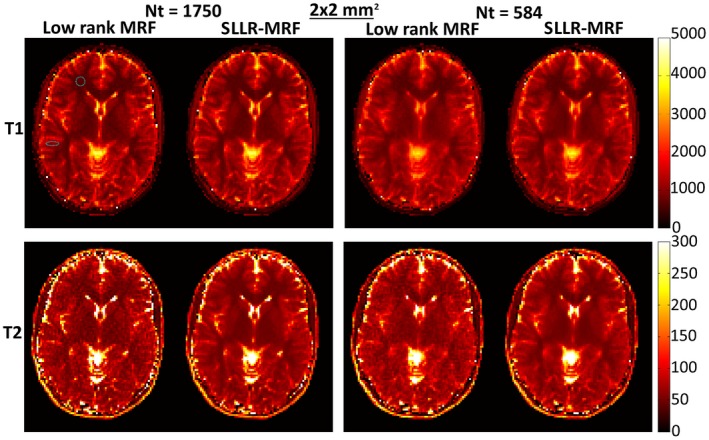
Figure 5.

T1 and T2 maps using low rank MRF and the proposed SLLR‐MRF with different amounts of data, for subject 1, 2 × 2 mm2 resolution in vivo. Residual blurring in T1 and noise amplification in T2 are present for low rank MRF, particularly when only 584 time‐points are used. SLLR‐MRF maintains similar parametric map quality even with a reduced number of time‐points. The dotted circles denote the regions of interest used to measure T1 and T2 values for white and gray matter, collected in Table 3
