
Figure 6.
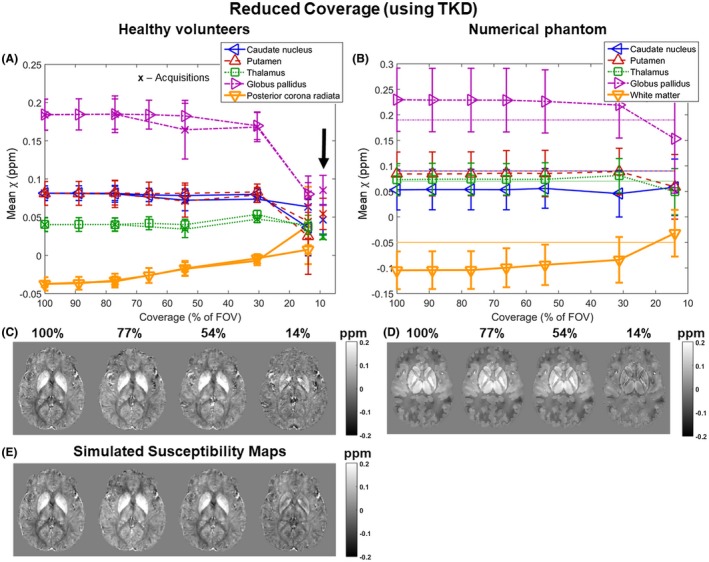
Susceptibility over varying coverage. Mean susceptibilities in 5 ROIs are plotted against coverage. Susceptibilities were averaged across 5 volunteers (A: x, acquisitions; triangles and square, simulations) and simulated in the numerical phantom (B: horizontal lines indicate the corresponding ground‐truth susceptibility values). The arrow (A) indicates mean susceptibilities in the ROIs calculated in the middle slice only in case of the lowest coverage acquisitions. The data acquired in volunteers (A) have error bars equal to the SD of the mean ROI values across the 5 volunteers. The error bars in the phantom results (B) correspond to the standard deviation within the ROIs. Axial slices of susceptibility maps calculated from images at different coverage acquired (C) or simulated (E) in a representative volunteer and simulated in the numerical phantom (D) are also shown