
Figure 10.
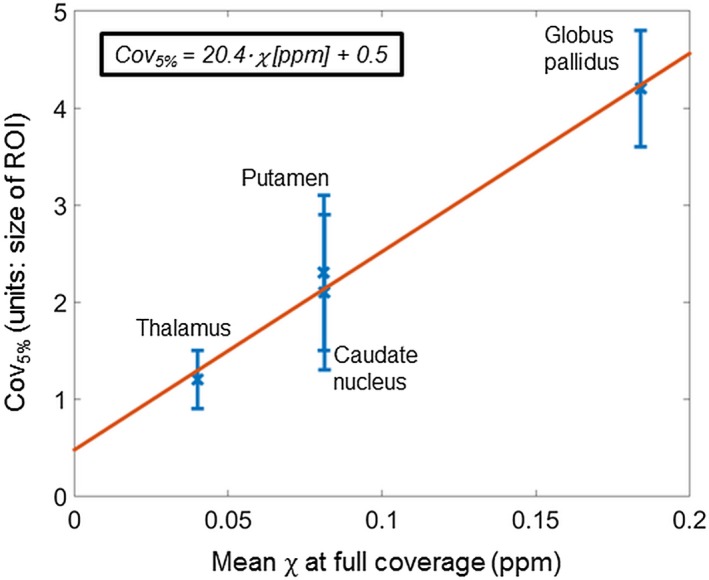
Linear relationship between the coverage necessary for a <5% decrease in susceptibility (Cov5%) and the mean susceptibility in 4 ROIs. The white matter region was excluded because of its high Cov5% (5.8 ± 0.4). This high value was caused by its off‐center location that means that even a slightly reduced coverage affected its induced fields. The other 4 ROIs were all very close to the middle in the head‐foot direction. The least squares linear equation is displayed in the top left corner