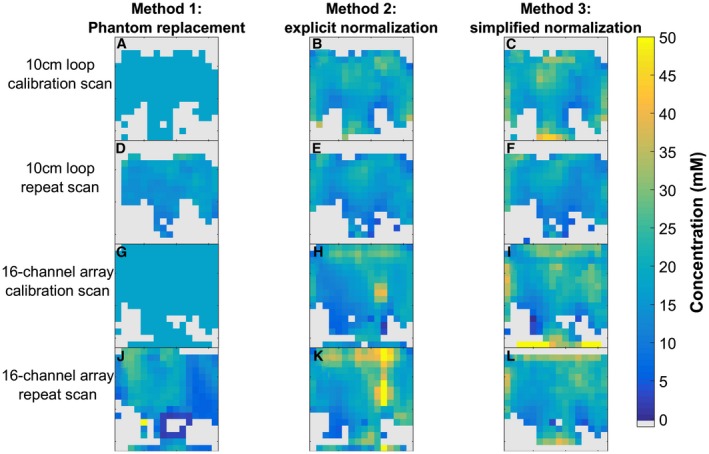
Figure 3.

Midtransverse slice illustrates the 3D data acquired from four 16 × 16 × 8 UTE‐CSI acquisitions of an 18‐mM K2HPO4 phantom, with sensitivity correction performed using 3 different methods. A‐F, The 10‐cm‐loop data. G‐I, The 16‐channel array data. A‐C,G‐I, Calibration scans. D‐F,J‐I, Repeat scans
