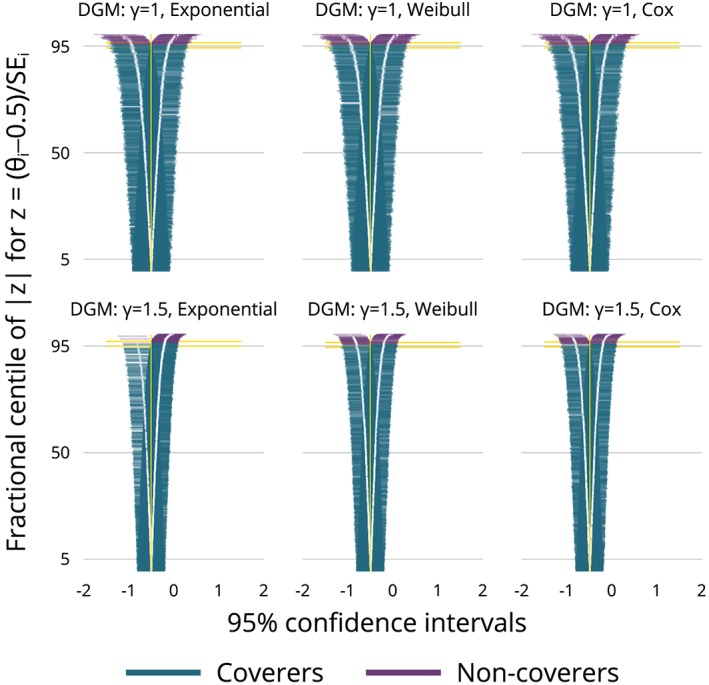
Figure 5.

“Zip plot” of the 1600 confidence intervals for each data‐generating mechanism and analysis method. The vertical axis is the fractional centile of |z| with associated with the confidence interval [Colour figure can be viewed at wileyonlinelibrary.com]
