Figure 1.

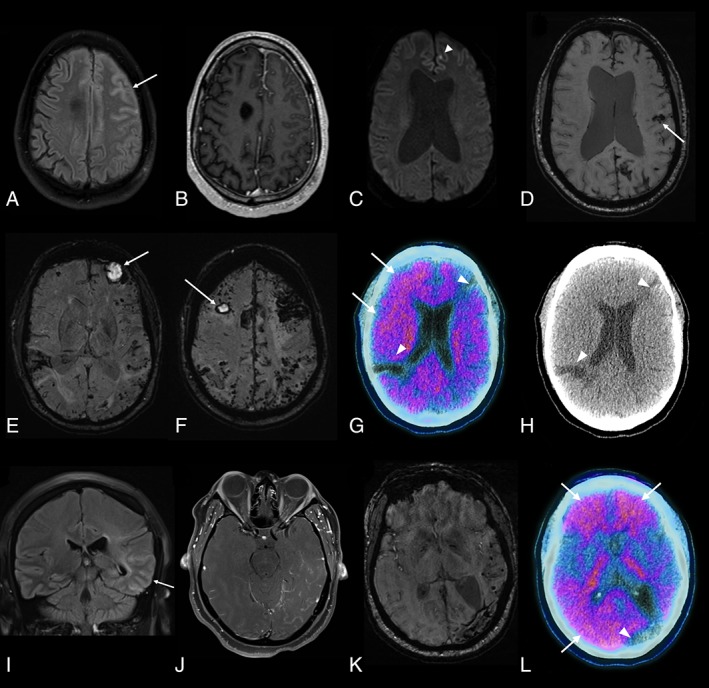
Brain imaging findings. (A–D) Case 1. Fluid‐attenuated inversion recovery (FLAIR; A), T1‐weighted postgadolinium (B), and diffusion‐weighted imaging (C) axial images acquired 2 months after initial presentation demonstrate left frontal gyral swelling and abnormal sulcal signal (arrow in A) with leptomeningeal enhancement (B) and a punctate focus of restricted diffusion (arrowhead). (D) Susceptibility‐weighted imaging 4 months later shows a lobar hemorrhage (arrow), multifocal superficial siderosis, and multiple microbleeds. The ventriculomegaly observed in C and D is longstanding (since the choroid plexus papilloma). (E–H) Case 2. (E, F) Susceptibility‐weighted imaging shows hematomas in both frontal lobes (arrows) and widespread superficial siderosis and microbleeds, visible as a band of low signal following the leptomeningeal surface of the brain and peripheral, punctate foci of low signal, respectively. (G) 18F‐Florbetapir positron emission tomographic (PET)–computed tomographic (CT) imaging shows increased uptake in frontal and parietal cortex (standardized uptake value [SUV] range = 0.0–2.8), suggestive of amyloid deposition (arrows). The 2 areas without uptake (arrowheads) correspond with areas of old hemorrhage, as seen on axial CT (H). (I–L) Case 3. FLAIR coronal (I) and T1‐weighted postgadolinium axial (J) images 15 months after initial presentation showing abnormal gyral and sulcal signal in the left temporal lobe (arrow) with associated leptomeningeal enhancement. (K) Susceptibility‐weighted imaging 5 months later showing hemosiderin deposition due to previous lobar hemorrhage and numerous temporal microbleeds. (L) Merged 18F‐florbetapir PET‐CT imaging shows increased uptake (SUV range = 0.0–3.4) in frontal and posterior (parietal and occipital) cortical regions (arrows); the area with reduced uptake (arrowhead) corresponds to the area of old hemorrhagic damage. [Color figure can be viewed at www.annalsofneurology.org]
