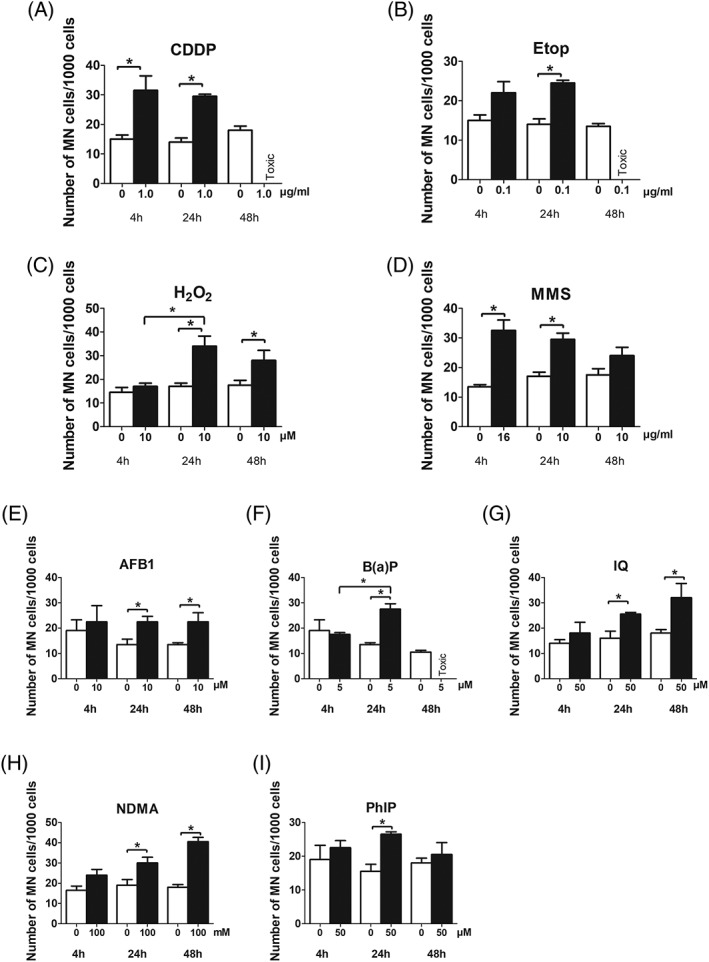
Figure 3.

Induction of MN after treatment of Huh6 cells with different direct (A–D) and indirect (E–I) acting mutagens for different time periods. CDDP, H2O2, MMS, and NDMA were dissolved in medium, Etop, AFB1, B(a)P, IQ, and PhiP were dissolved in DMSO. Bars show means ± SD of results obtained in a representative experiment. Two cultures were treated per experimental point and from each, at least 1,000 BNC cells were evaluated. Data were evaluated by generalized linear model with Poisson counts. Chi‐square tests for overdispersion were applied. Stars indicate statistical significance (P ≤ 0.05).
